Fig. 1
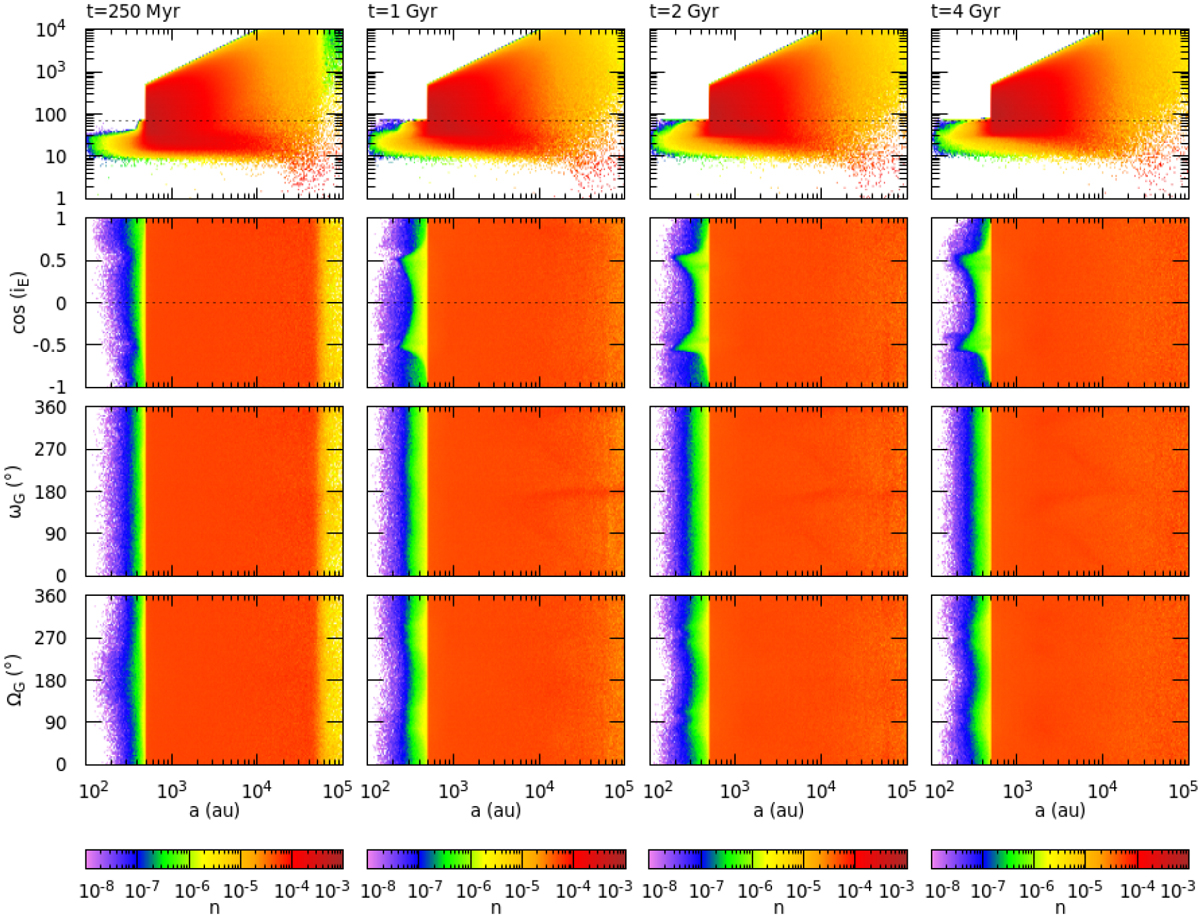
From top to bottom panels: distribution of comets in (a, q), (a, cos (iE), (a, ωG) and (a, ΩG) planes at four different epochs t = 250 Myr and 1, 2 and 4 Gyr. For visibility, the bin sizes are constant along any axis. However the density function is computed in number of comets per au for the perihelion distance and per au−1 for the semi-major axis. The data comes from the evolution of the I0 proto-Oort cloud.
Current usage metrics show cumulative count of Article Views (full-text article views including HTML views, PDF and ePub downloads, according to the available data) and Abstracts Views on Vision4Press platform.
Data correspond to usage on the plateform after 2015. The current usage metrics is available 48-96 hours after online publication and is updated daily on week days.
Initial download of the metrics may take a while.