Fig. 7
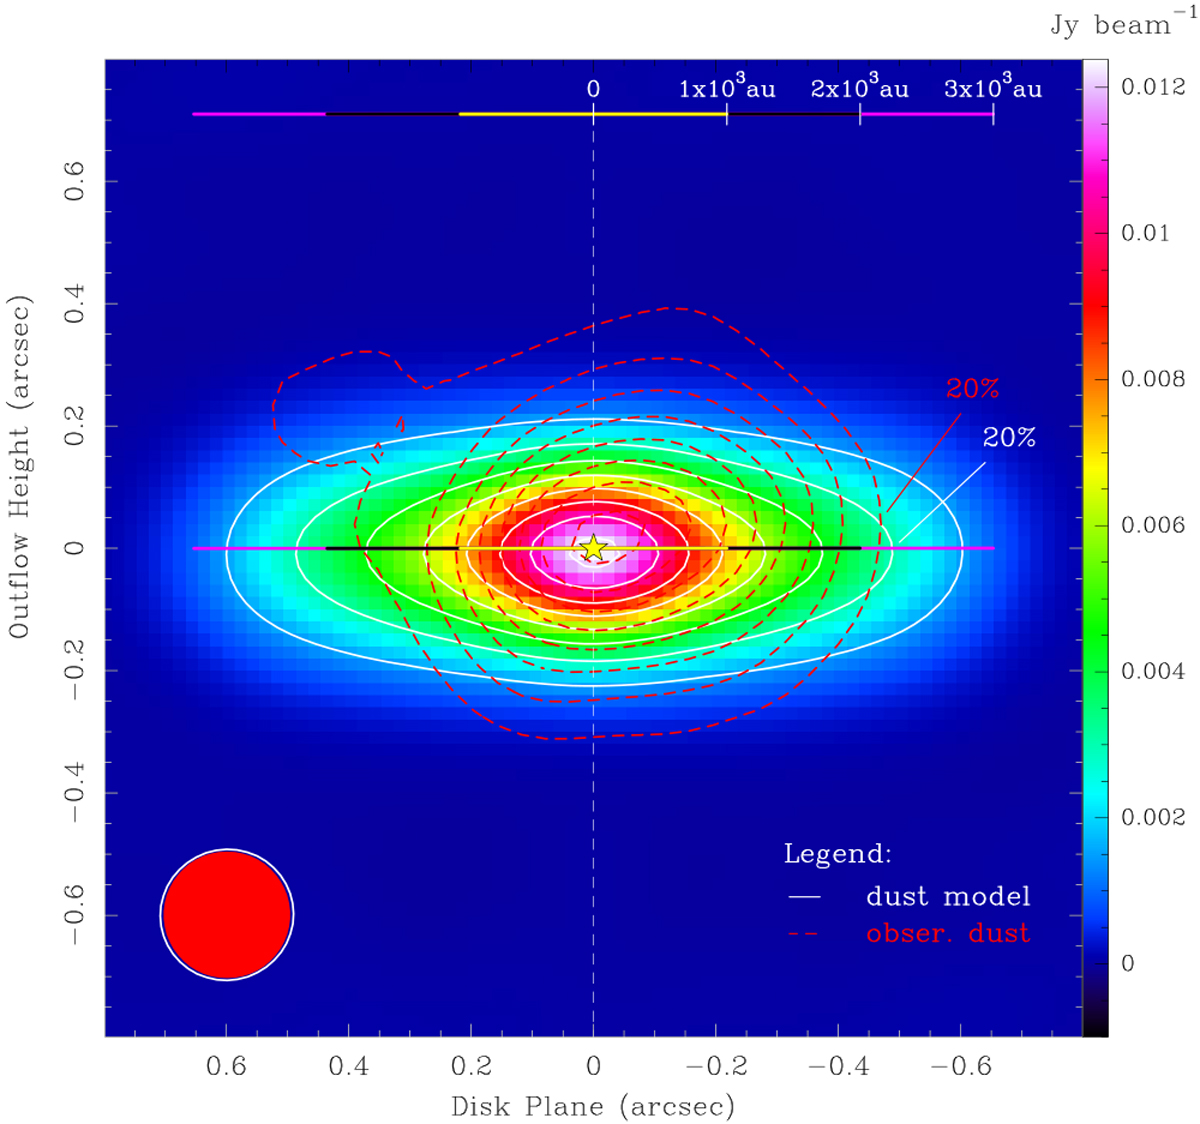
Analysis of the dust continuum emission from the disk. Comparison of the dust emission observed with ALMA towards G023.01−00.41 (red dashed contours) with the modelled dust emission from a circumstellar disk around a 20 M⊙ star (colours and white contours). The brightness scale of the modelled emission is quantified by the righthand wedge. The red dashed contours are plotted at steps of 10% of the observed peak emission, starting from 90%; the white contours draw the same absolute levels for the model. The reference system and symbols are the same used in the previous figures. The synthesized ALMA beams, for the observed (red filled circle) and modelled (white circle) dust continuum maps, are shown in the bottom left corner.
Current usage metrics show cumulative count of Article Views (full-text article views including HTML views, PDF and ePub downloads, according to the available data) and Abstracts Views on Vision4Press platform.
Data correspond to usage on the plateform after 2015. The current usage metrics is available 48-96 hours after online publication and is updated daily on week days.
Initial download of the metrics may take a while.