Fig. 5
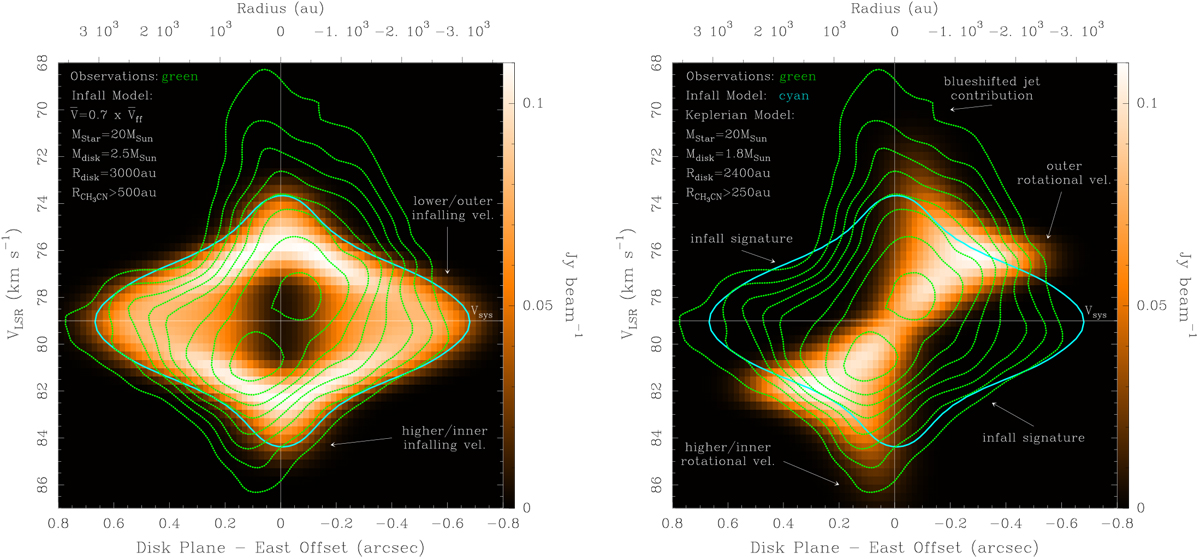
Modelled pv-diagrams of the CH3CN (124–114) line emission (colour scale) along the plane of a circumstellar disk around a 20 M⊙ star. The disk is inclined by 10° with respect to the line of sight. Left panel: pv-diagram obtained under the assumption of an infalling velocity field between radii of 3000 and 500 au from the central star. At each point, the magnitude of the velocity vectors is 70% of the free-fall velocity. The plot limits and symbols are the same as those used in Fig. 4. For comparison, the green contours are those plotted for the same CH3 CN line in Fig. 4; the cyan (modelled) contour marks the same absolute level of the outer observed isocontour. This infalling profile well reproduces the observed velocities in the second and fourth quadrants, and represents clear evidence of an accretion flow through the disk. Right panel: similar to the left panel, but for a purely Keplerian motion. The gas emission now extends between radii of 2400 and 250 au from the central star. The cyan contour is the same as in the left panel. This rotational profile well reproduces the higher redshifted velocities detected in the third quadrant (lower greencontours). The green contours also match the outer rotational velocities in the first quadrant.
Current usage metrics show cumulative count of Article Views (full-text article views including HTML views, PDF and ePub downloads, according to the available data) and Abstracts Views on Vision4Press platform.
Data correspond to usage on the plateform after 2015. The current usage metrics is available 48-96 hours after online publication and is updated daily on week days.
Initial download of the metrics may take a while.