Fig. 4
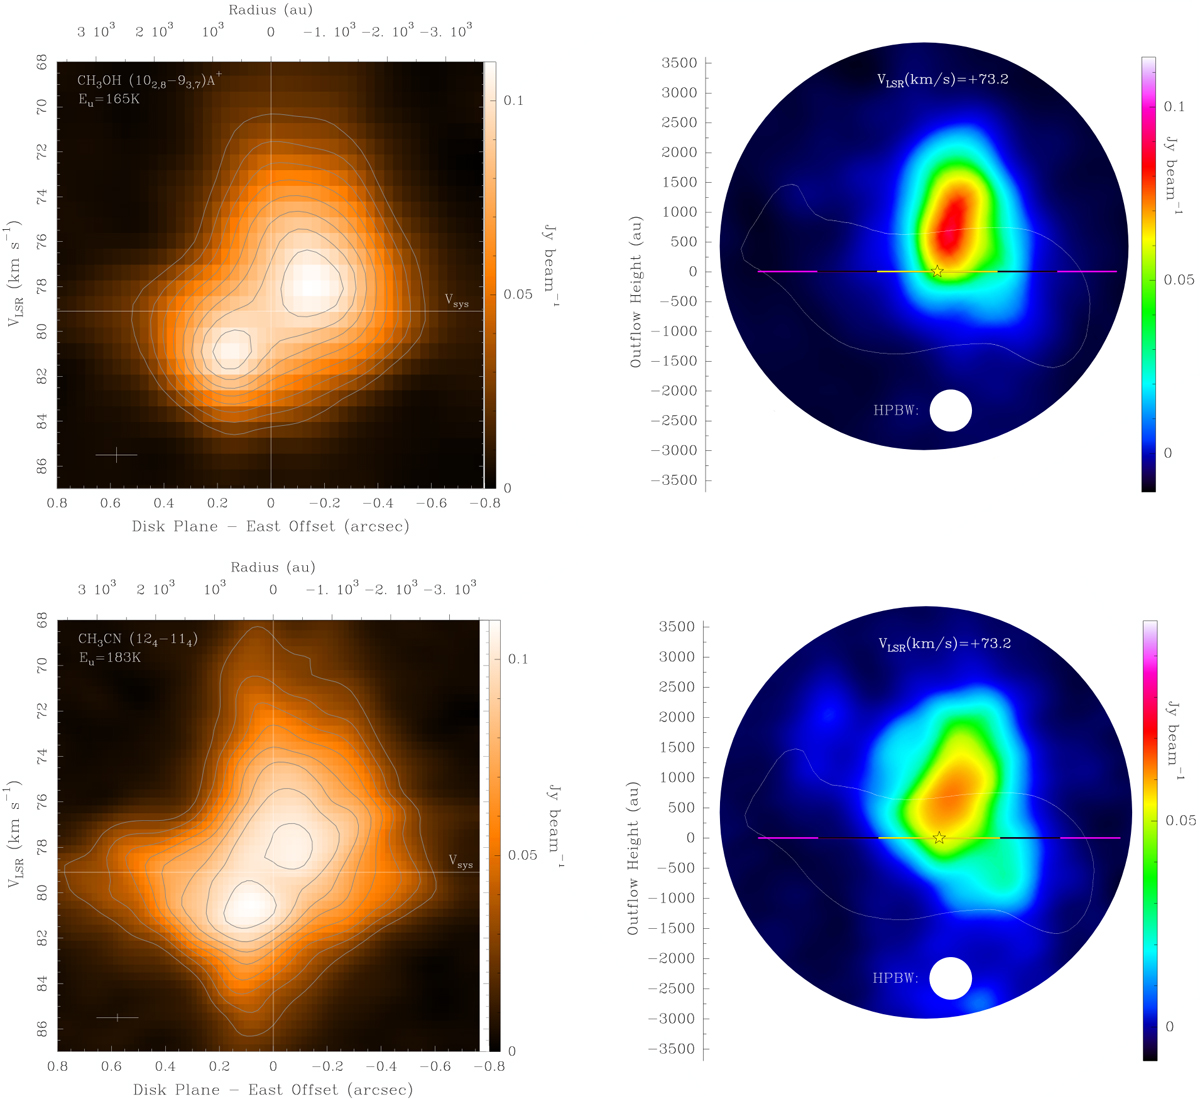
Velocity field analysis of the CH3OH (upper panels) and CH3CN (lowerpanels) line emission along the disk plane. Left column: pv-diagrams of gas lying along the disk plane (cut at − 33°). Molecular labels are on the upper left corner of each panel. East offsets are measured along the disk plane starting from the YSO position; the same scale in astronomical units is written on the upper axis. For each panel, contours start at 90% of the peak emission and decrease by 10% steps; colours are drawn according to the wedges on the right sides. The rest velocity of the star is set at + 79.1 km s−1. The spatial and spectral resolutions are indicated in the bottom left corners. The CH3 CN observationshave two times higher spectral resolution than those of the CH3OH line. Right column: channel maps of the blueshifted jet component at a velocity of + 73.2 km s−1, which contributes to the high blueshifted velocities in the pv-diagrams on the left. Symbols are as in Figs. 1 and 3.
Current usage metrics show cumulative count of Article Views (full-text article views including HTML views, PDF and ePub downloads, according to the available data) and Abstracts Views on Vision4Press platform.
Data correspond to usage on the plateform after 2015. The current usage metrics is available 48-96 hours after online publication and is updated daily on week days.
Initial download of the metrics may take a while.