Fig. 3
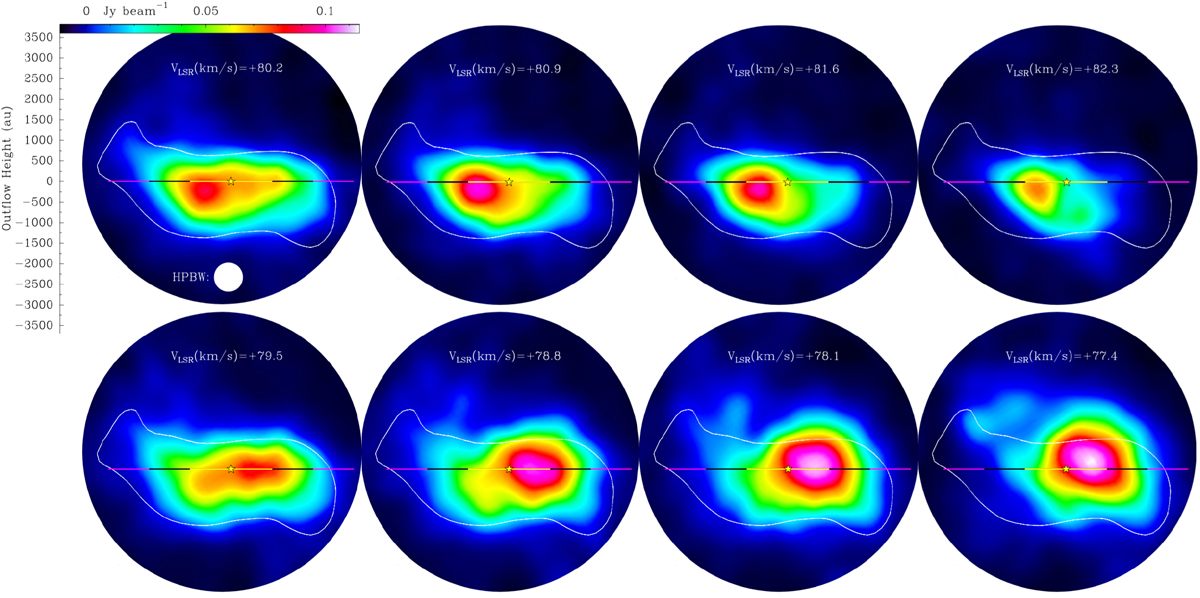
Channel maps of the CH3OH (102,8–93,7) A+ line emission (colours) observed at 700 au resolution with ALMA (synthesized beam in white). Each map is labelled by its central velocity (VLSR). The brightness scale of the line emission is quantified by the wedge on the top left panel. The reference system and symbols in each channel map are the same as those used in Fig. 1. For comparison, the white contour corresponds to the dotted black contour of Fig. 1.
Current usage metrics show cumulative count of Article Views (full-text article views including HTML views, PDF and ePub downloads, according to the available data) and Abstracts Views on Vision4Press platform.
Data correspond to usage on the plateform after 2015. The current usage metrics is available 48-96 hours after online publication and is updated daily on week days.
Initial download of the metrics may take a while.