Fig. 2
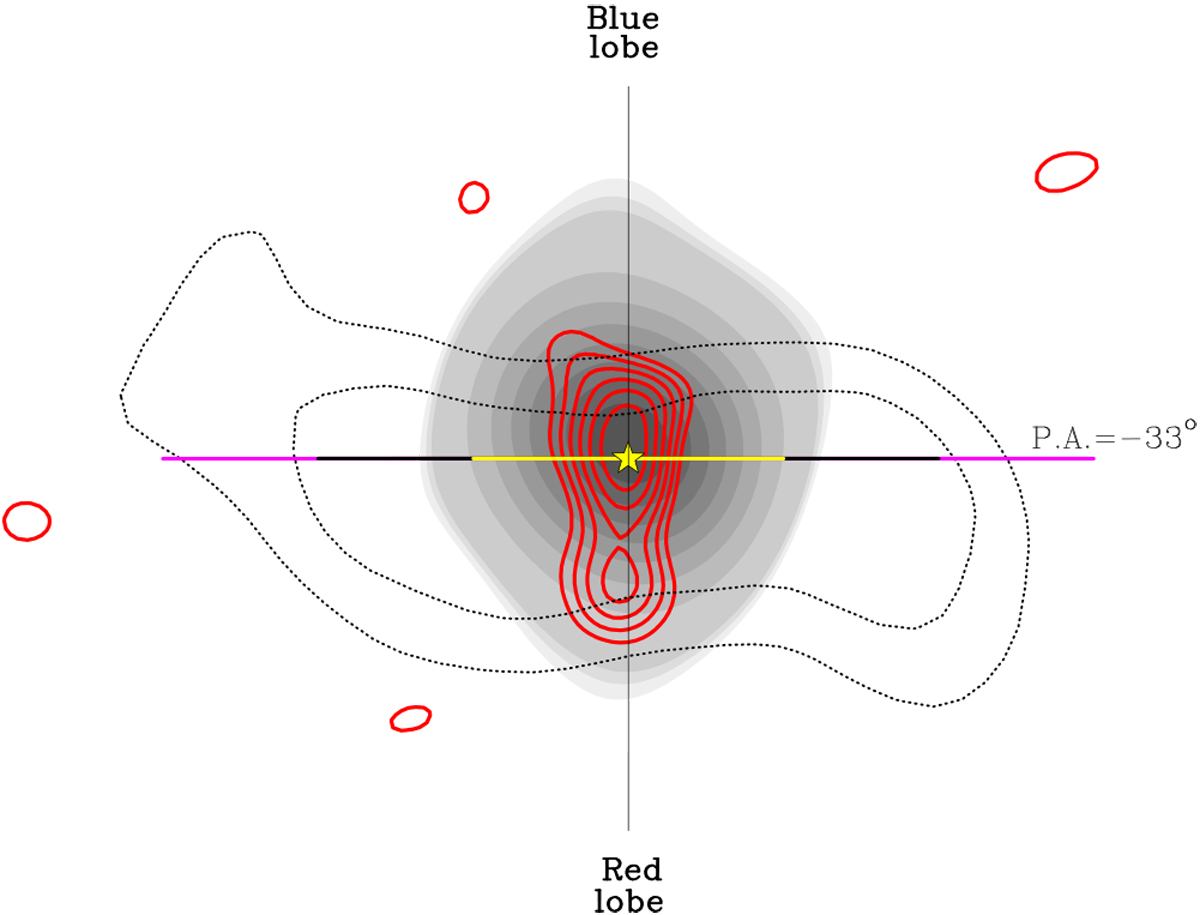
Comparison between the disk emission imaged in Fig. 1 (dotted profile) and the radio continuum emission at 22 GHz (grey) and 45 GHz (red) detected towards G023.01−00.41. Dotted contours mark the 60 and 80% levels of the CH3OH (42,2–31,2) E line emission showing the disk morphology. The disk plane at a position angle of − 33° and the star position are defined as in Fig. 1. The radio continuum emission imaged with the Karl G. Jansky Very Large Array, at a similar resolution to the ALMA observations, traces a radio thermal jet (from Sanna et al. 2016). The lower three contours of the 22 GHz emission start at 5 σ by 1 σ steps of 8 μJy beam−1, and then increase at steps of 10 σ. The 45 GHz contours start at 3 σ by 1 σ steps of 22 μJy beam−1. The outflow direction perpendicular to the disk plane is indicated by a black line, and the orientation of the blueshifted and redshifted outflow lobes is also specified. The linear scale of the image is quantified by the coloured ticks along the disk plane (see Fig. 1).
Current usage metrics show cumulative count of Article Views (full-text article views including HTML views, PDF and ePub downloads, according to the available data) and Abstracts Views on Vision4Press platform.
Data correspond to usage on the plateform after 2015. The current usage metrics is available 48-96 hours after online publication and is updated daily on week days.
Initial download of the metrics may take a while.