Fig. 1
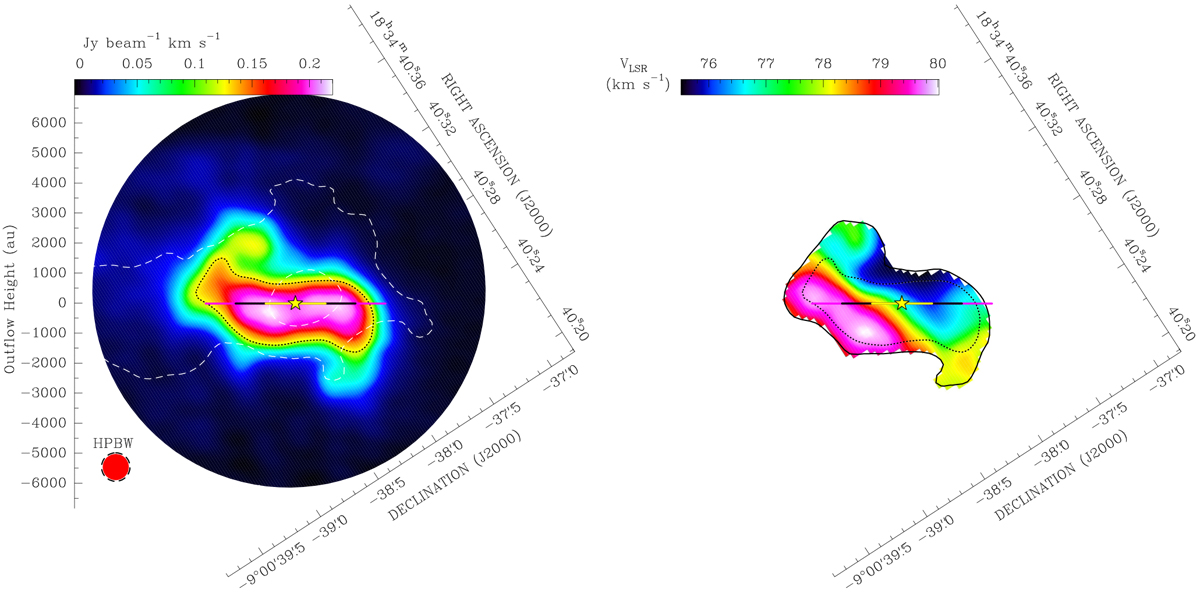
Kinematic analysis of a low excitation-energy line (Eup of 45 K) of the methanol gas emission towards G023.01−00.41. Left panel: moment-zero map of the CH3OH (42,2–31,2) E line emission (colours) combined with the continuum map of the dust emission at 1.37 mm (dashed white contours). Maps have been rotated clockwise by a position angle of − 57°, in order to align the (projected) outflow axis, drawn on the left side, with the north-south axis; negative outflow heights indicate the receding outflow direction. The CH3 OH emission was integrated in the range 78.8–80.2 kms−1; the wedge on the top left corner quantifies the line intensity, from its peak to the maximum negative in the map. The lowest dashed contour corresponds to the 10 σ level of the dust map, and the inner contour traces the 50% level from the continuum peak emission. The disk plane is drawn at three radii: from the central star position (star) to 1000 au (yellow), from 1000 to 2000 au (black), and up to 3000 au (pink). The dotted black contour draws the 60% level of the CH3 OH emission, which identifies the disk profile (see text). The synthesized ALMA beams, for the dust continuum map (dashed circle) and the line map (red circle), are shown in the bottom left corner. Right panel: first-moment map (colours) of the CH3 OH (42,2–31,2) E line emission plotted in the left panel. The outer contour traces the 40% level of the moment-zero map; the inner dotted contour is the same as in the left panel. The LSR velocity scale is drawn in the upper left.
Current usage metrics show cumulative count of Article Views (full-text article views including HTML views, PDF and ePub downloads, according to the available data) and Abstracts Views on Vision4Press platform.
Data correspond to usage on the plateform after 2015. The current usage metrics is available 48-96 hours after online publication and is updated daily on week days.
Initial download of the metrics may take a while.