Fig. 8
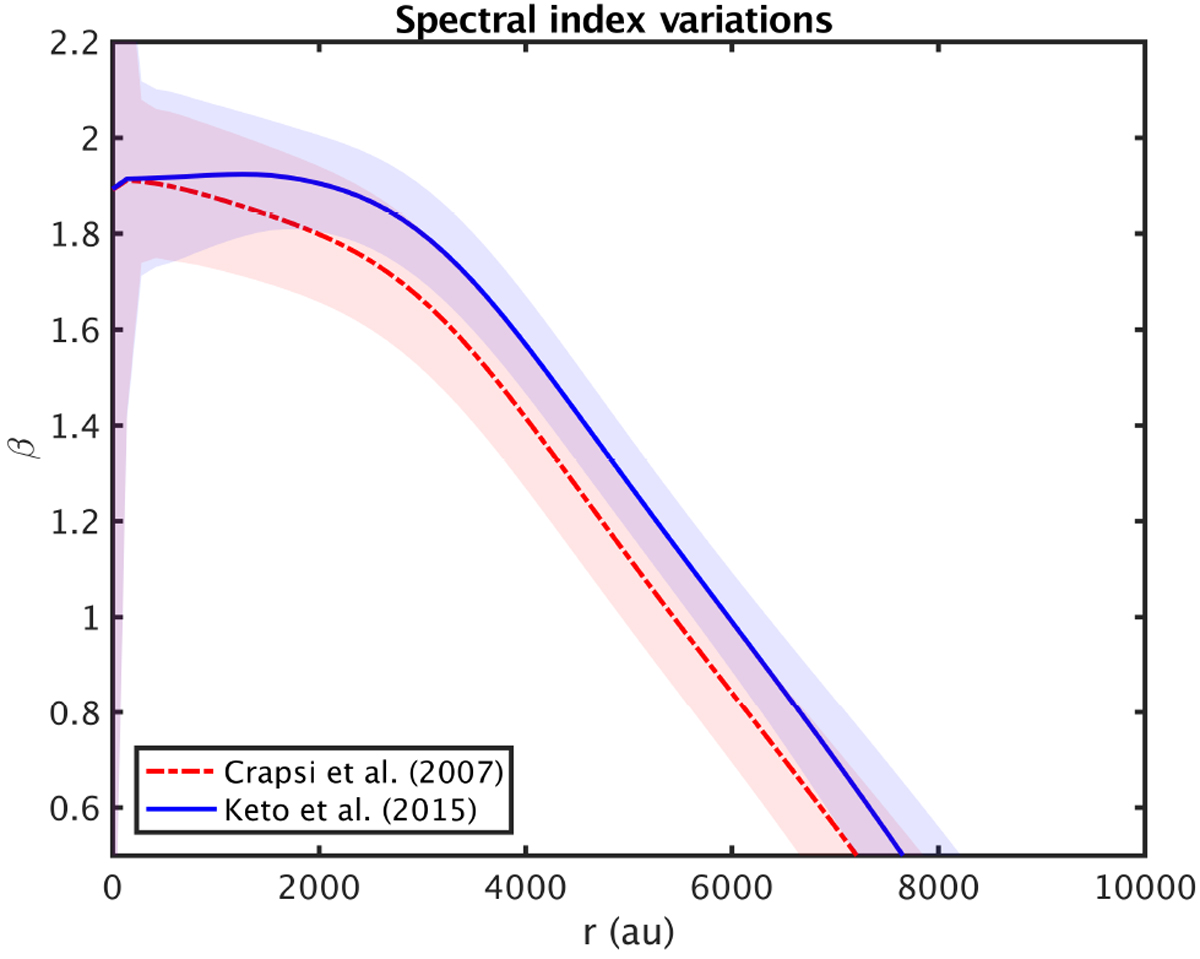
Spectral index radial variations obtained as explained in Sect. 3.2. This figure shows β(r), while Fig. 6 shows β(r) averaged along the line of sight, i.e., ![]() . The different colors refer to the different physical structure adopted (blue for Keto et al. 2015 and red for Crapsi et al. 2007). The shaded regions show the error associated with the process.
. The different colors refer to the different physical structure adopted (blue for Keto et al. 2015 and red for Crapsi et al. 2007). The shaded regions show the error associated with the process.
Current usage metrics show cumulative count of Article Views (full-text article views including HTML views, PDF and ePub downloads, according to the available data) and Abstracts Views on Vision4Press platform.
Data correspond to usage on the plateform after 2015. The current usage metrics is available 48-96 hours after online publication and is updated daily on week days.
Initial download of the metrics may take a while.