Free Access
Fig. 4
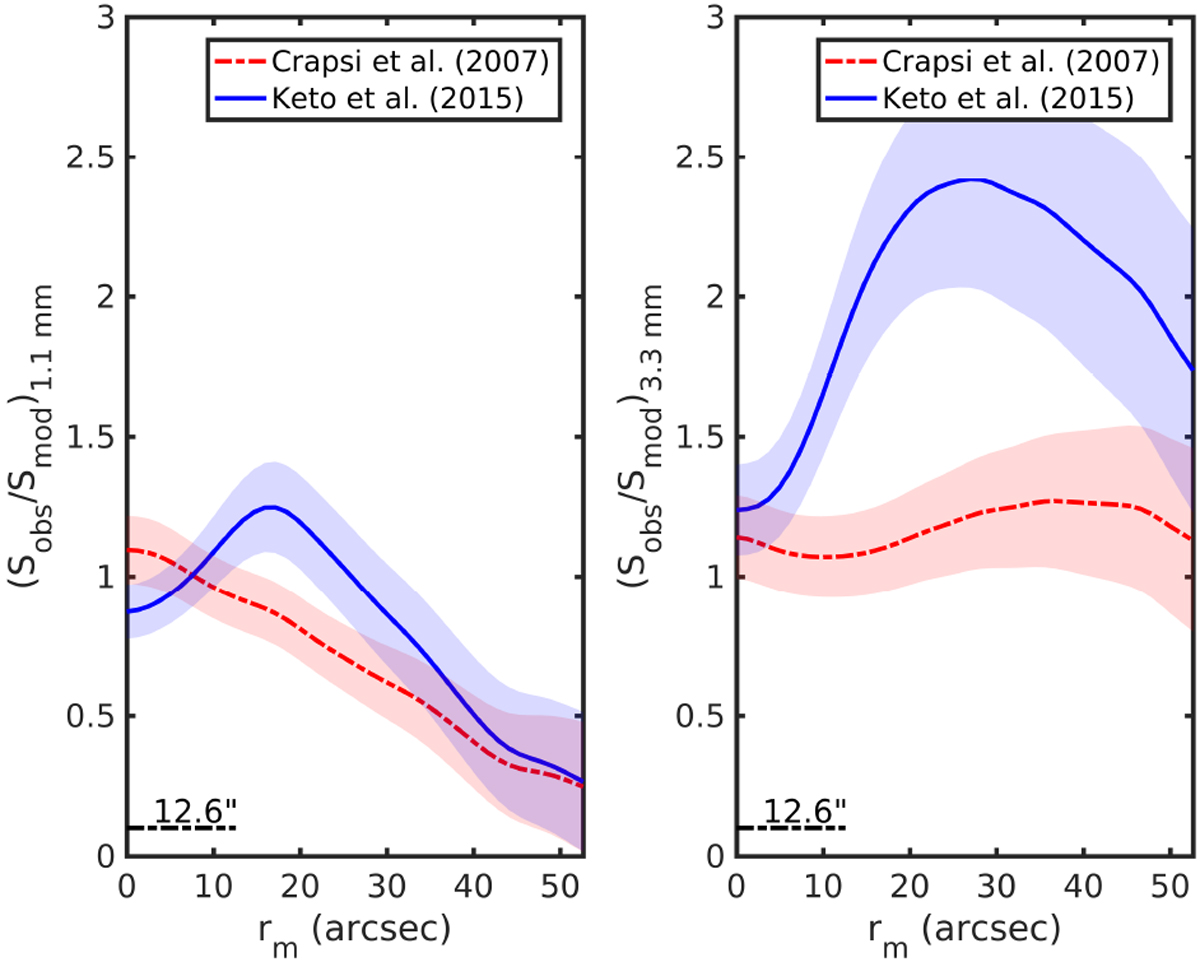
Ratio of the observed emission to the modeled emission derived as described in Sect. 3.2, as a function of projected radius rm. The shaded regions show the error associated with the data. The resolution of the maps is indicated with a bar of length 12.6′ ′ in the bottom left corner of both panels.
Current usage metrics show cumulative count of Article Views (full-text article views including HTML views, PDF and ePub downloads, according to the available data) and Abstracts Views on Vision4Press platform.
Data correspond to usage on the plateform after 2015. The current usage metrics is available 48-96 hours after online publication and is updated daily on week days.
Initial download of the metrics may take a while.