Free Access
Fig. G.2
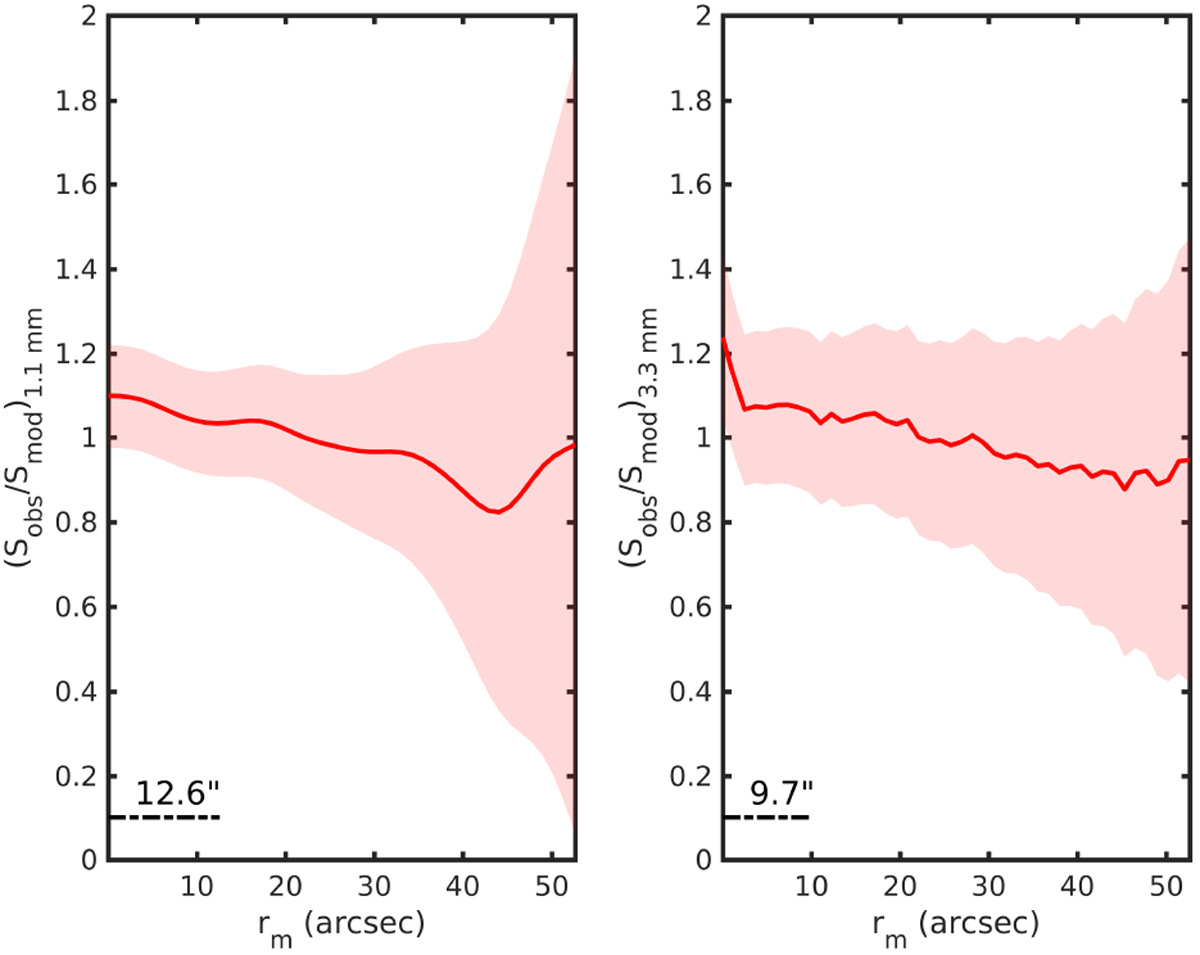
Ratio of the observed emission profiles to the modeled emission profiles taking into account the radial opacity variations and new density and temperature profiles, as explained in Sect. 3.3. The shaded regions show the noise associated with the data, and the bars the resolution of the data.
Current usage metrics show cumulative count of Article Views (full-text article views including HTML views, PDF and ePub downloads, according to the available data) and Abstracts Views on Vision4Press platform.
Data correspond to usage on the plateform after 2015. The current usage metrics is available 48-96 hours after online publication and is updated daily on week days.
Initial download of the metrics may take a while.