Fig. B.1
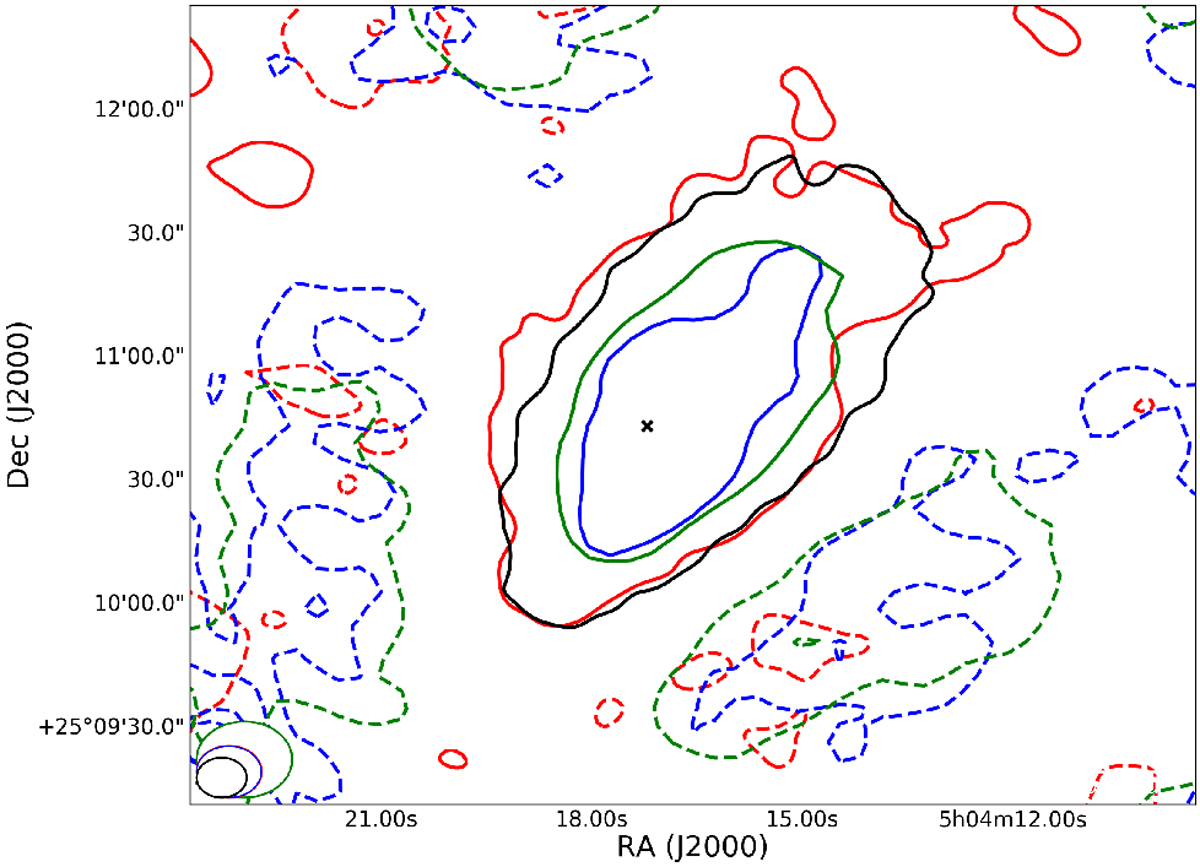
Contour map of the emission of L1544 observed with NIKA at 1.25 mm (in blue) and 2 mm (in green) by Chacón-Tanarro et al. (2017), together with that observed with AzTEC at 1.1 mm (in red) and MUSTANG-2 at 3.3 mm (in black). The corresponding solid lines follow each 3σ contour, while the dashed lines follow the negative bowls formed due to filtering, indicating a −10% of the peak emission of each map. The HPBWs are on the bottom left corner of the figure.
Current usage metrics show cumulative count of Article Views (full-text article views including HTML views, PDF and ePub downloads, according to the available data) and Abstracts Views on Vision4Press platform.
Data correspond to usage on the plateform after 2015. The current usage metrics is available 48-96 hours after online publication and is updated daily on week days.
Initial download of the metrics may take a while.