Fig. 10
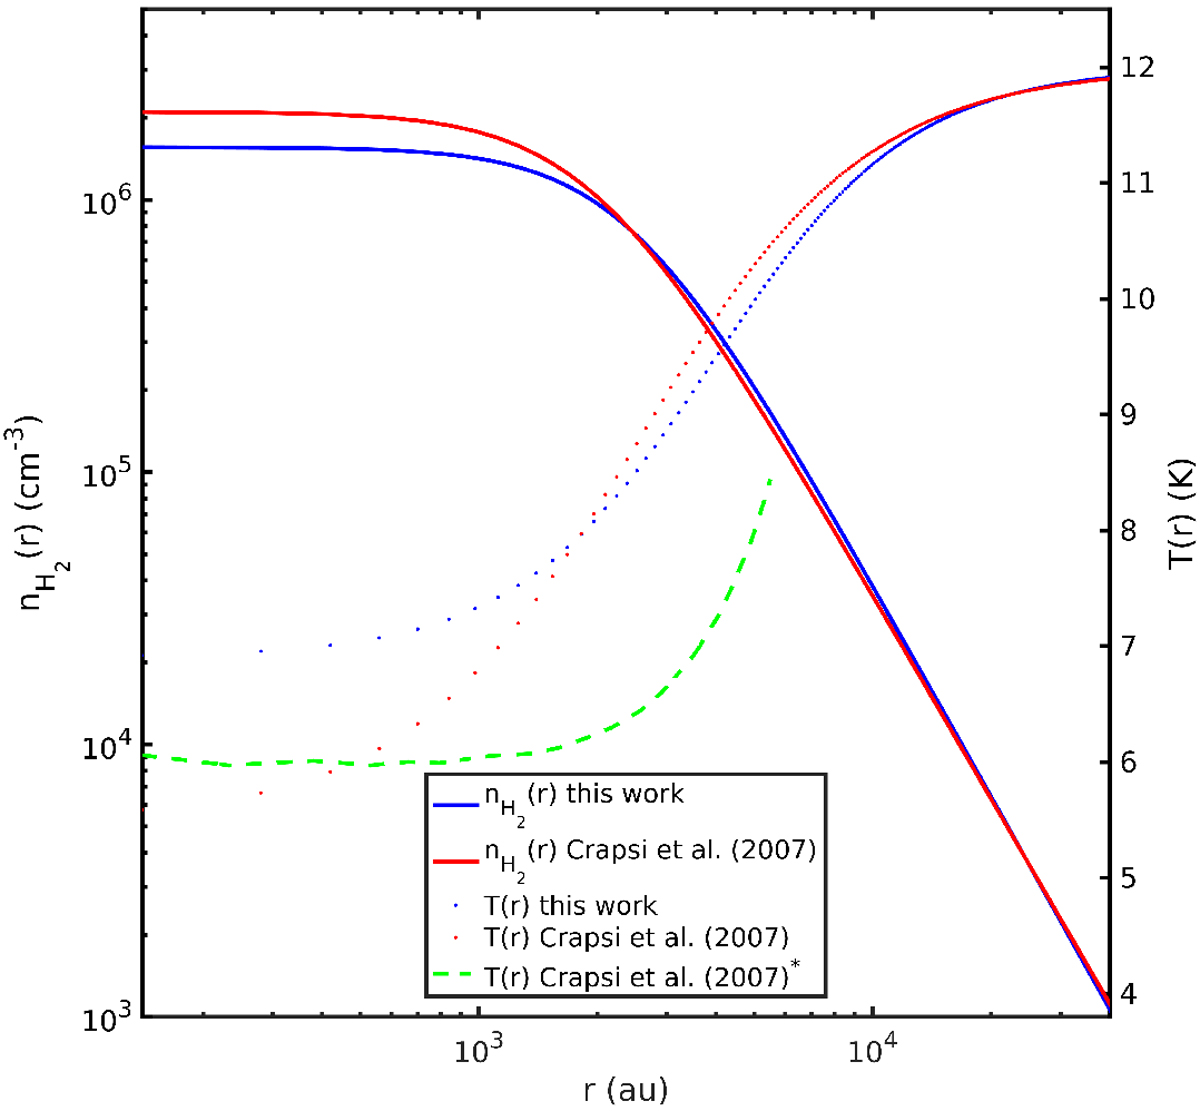
New density (blue solid line) and temperature (blue dotted line) profiles derived as described in Sect. 3.3. In red, density (solid line) and temperature (dotted line) profiles from Crapsi et al. (2007). In green, temperature profile from Crapsi et al. (2007) derived using the formulae from Zucconi et al. (2001, their Fig. 4), marked in the legend as Crapsi et al. (2007)*.
Current usage metrics show cumulative count of Article Views (full-text article views including HTML views, PDF and ePub downloads, according to the available data) and Abstracts Views on Vision4Press platform.
Data correspond to usage on the plateform after 2015. The current usage metrics is available 48-96 hours after online publication and is updated daily on week days.
Initial download of the metrics may take a while.