Fig. C.2
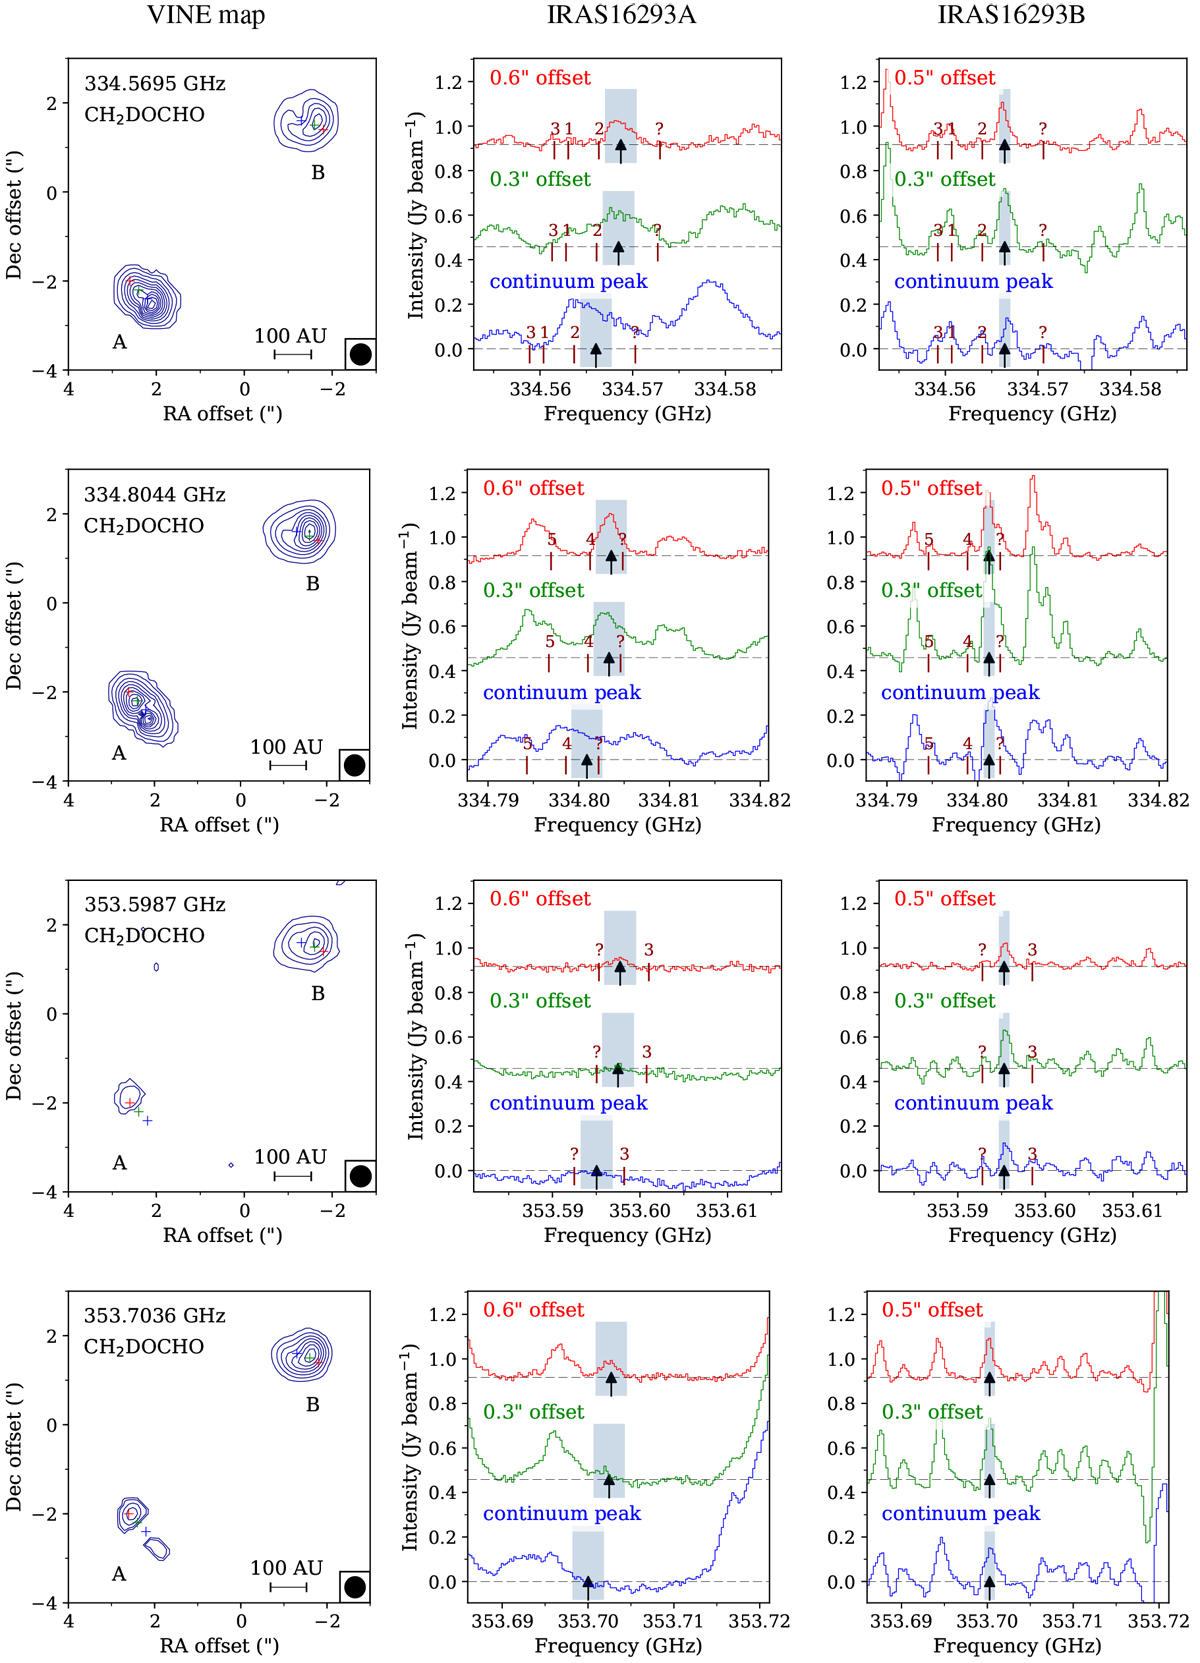
VINE maps of the brightest CH2DOCHO transitions. Contour levels start at 3σ and increase in steps of 3σ for the 353 599 and 353 704 GHz lines and 6σ for the 334569 and 334 804 GHz lines. The integration range is indicated with a grey rectangle on spectra extracted from three positions, marked with coloured crosses on the map: the continuum peak position in blue, the 0.′′3 offset position in green, and the 0.′′6 (0.′′5 for source B) offset position in red, towards IRAS 16293A (middle panels) and B (right panels). The black arrow indicates the rest frequency of the mapped transition. Numbered indicatorscorrespond to other species with a line close to the transition of interest: (1) CH2 (OH)CHO, (2) CH3CH2OH, (3) CH3O13CHO, (4) CH3CHO, (5) CH3COCH3, (?) Unidentified.
Current usage metrics show cumulative count of Article Views (full-text article views including HTML views, PDF and ePub downloads, according to the available data) and Abstracts Views on Vision4Press platform.
Data correspond to usage on the plateform after 2015. The current usage metrics is available 48-96 hours after online publication and is updated daily on week days.
Initial download of the metrics may take a while.