Open Access
Fig. 3.
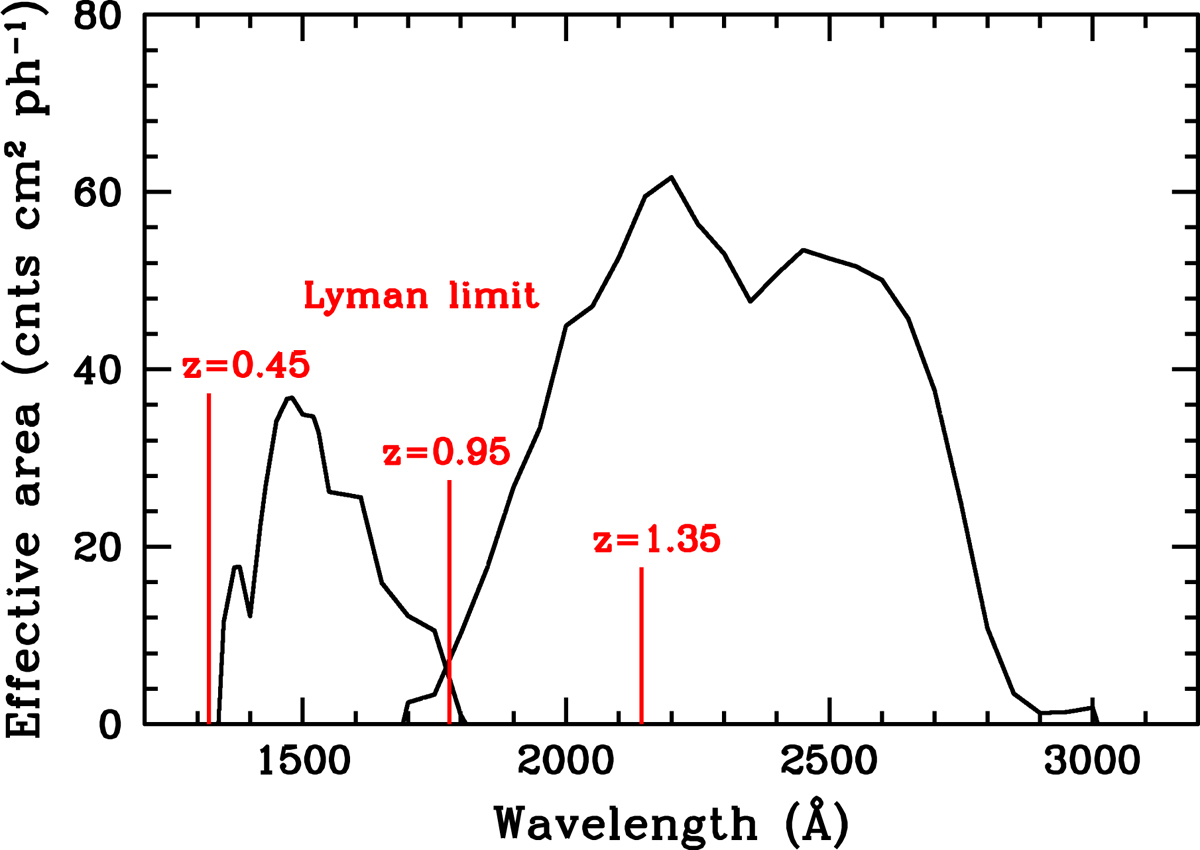
Effective area (counts cm2 photon−1) of the FUV and NUV GALEX bandpasses (Morrissey et al. 2007). The vertical (red) tick marks indicate the position with respect to the bandpasses of the Lyman break at redshifts 0.45, 0.95 and 1.35.
Current usage metrics show cumulative count of Article Views (full-text article views including HTML views, PDF and ePub downloads, according to the available data) and Abstracts Views on Vision4Press platform.
Data correspond to usage on the plateform after 2015. The current usage metrics is available 48-96 hours after online publication and is updated daily on week days.
Initial download of the metrics may take a while.