| Issue |
A&A
Volume 622, February 2019
|
|
|---|---|---|
| Article Number | L14 | |
| Number of page(s) | 5 | |
| Section | Letters to the Editor | |
| DOI | https://doi.org/10.1051/0004-6361/201834840 | |
| Published online | 19 February 2019 | |
Letter to the Editor
Gas infall and possible circumstellar rotation in R Leonis⋆
1
Molecular Astrophysics Group, Instituto de Física Fundamental, CSIC, C/ Serrano, 123, 28006
Madrid, Spain
e-mail: This email address is being protected from spambots. You need JavaScript enabled to view it.
2
Observatorio Astronómico Nacional, OAN-IGN, Alfonso XII, 3, 28014
Madrid, Spain
3
Dept. of Space, Earth, and Environment, Astronomy and Plasma Physics Division, Chalmers University of Technology, Onsala Space Observatory, 439 92
Onsala, Sweden
Received:
12
December
2018
Accepted:
6
February
2019
Abstract
We present new interferometer molecular observations of R Leo taken at 1.2 mm with the Atacama Large Millimeter Array with an angular resolution up to ≃0.″026. These observations permitted us to resolve the innermost envelope of this star, which revealed a complex structure that involves extended continuum emission and molecular emission showing a non-radial gas velocity distribution. This molecular emission displays prominent red-shifted absorptions located immediately in front of the star, which are typical footprints of material infall. This emission also shows lateral gas motions compatible with a torus-like structure.
Key words: stars: AGB and post-AGB / stars: individual: R Leo / circumstellar matter / stars: mass-loss / techniques: interferometric / techniques: high angular resolution
This paper makes use of the following ALMA data: ADS/JAO.ALMA#2016.1.01202.S. ALMA is a partnership of ESO (representing its member states), NSF (USA) and NINS (Japan), together with NRC (Canada), MOST and ASIAA (Taiwan), and KASI (Republic of Korea), in cooperation with the Republic of Chile. The Joint ALMA Observatory is operated by ESO, AUI/NRAO and NAOJ.
© ESO 2019
1. Introduction
R Leo is an O-rich asymptotic giant branch star (AGB) located at ≃70 − 85 pc from Earth (De Beck et al. 2010; Ramstedt & Olofsson 2014). It has an effective temperature of ≃2500−3000 K and an angular diameter of  in the K band (Perrin et al. 1999; Fedele et al. 2005; Wittkowski et al. 2016). It pulsates with a period of ≃310 days, ejecting processed material with a low mass-loss rate of ≃1.0 × 10⁻⁷M⊙ yr−1 and a terminal velocity of 6−9 km s−1 (Bujarrabal et al. 1994; Cernicharo et al. 1997).
The continuum at different wavelengths (optical, infrared, and millimeter) together with the thermal and maser molecular emissions coming from this star have been analysed with different observing techniques (e.g. Castelaz & Luttermoser 1997; Pardo et al. 1998; Ryde et al. 1999; González-Delgado et al. 2003; Soria-Ruiz et al. 2007). Some of these observations suggested the existence of complex structures in the innermost envelope. Cernicharo et al. (1994) carried out lunar occultation observations of the SiO(v = 1, J = 2 − 1) maser, finding a low-velocity structure within the  sized region around the star that could be interpreted as a developing bipolar outflow or a rotating torus. However, the limited spatial information perpendicular to the occultation direction achieved was insufficient to properly constrain this structure. Additional asymmetries were found at larger scales by Plez & Lambert (1994), suggesting that the structure revealed by Cernicharo et al. (1994) could be part of a larger structure that covers a significant fraction of the envelope.
In this Letter, we present new interferometer observations of CO and 29SiO towards the AGB star R Leo. They were carried out with the Atacama Large Millimeter Array (ALMA) with an angular resolution of up to  , which is comparable to the size of the star.
2. Observations
We observed R Leo with ALMA during Cycles 4 and 5 within the frame of project 2016.1.01202.S. Array configurations C40-2, C40-5, C40-6, and C43-9 were used and provided baselines from 15 m up to 13.9 km. These observations give a complete view of the envelope of R Leo at different scales along ≃1.25 pulsation periods. The observation details can be found in Table 1.
Observation summary.
Four spectral windows covered the frequency ranges 212.7−216.8 and 227.5−231.5 GHz with a channel width of 488 kHz. The flux, bandpass, and pointing were calibrated in the usual way by observing J0854+2006 or J1058+0133. We estimate a flux error ≃5%. The phase calibrators and check sources J1002+1216, J1008+0621, and J0946+1017 were periodically observed. R Leo was observed twice with configuration C43-9. In the first run (run A), the baseline of one spectral window was affected by strong spurious periodic spikes, the weather was not good enough for this demanding configuration (PWV ≃ 1.2 mm), and the uv plane coverage was limited. The data quality greatly increased during the second run (run B), and run A was deprecated. The data were calibrated with the pipeline in CASA 4.7.2 (McMullin et al. 2007).
Mapping and data analysis were almost fully performed with GILDAS1. The images were restored adopting a robust parameter of 1.0 and 0.1 (natural and uniform weighting, hereafter). We estimate a positional uncertainty for the highest angular resolution of  from the standard deviation of the emission peak position of the phase calibrator over time (Menten et al. 2006; Fonfría et al. 2014).
In this Letter, we focuse on the short-scale observations to describe the stellar vicinity. The analysis of the envelope through the larger-scale maps is beyond the scope of this work and will be presented elsewhere (Fonfría et al., in prep.). Owing to the stellar pulsation phase incoherence and the long time lag (≃1.1 yr), the data taken with the C40-6 and C43-9 configurations were not merged to prevent artefacts.
3. Results and discussion
3.1. Structure of the continuum emission
The observations show one continuum emission source in the region of the sky that is covered by the primary beam (Fig. 1). It peaks at (RA, Dec)=( ).
).
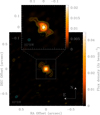 |
Fig. 1. Continuum emission observed with configuration C43-9, run B, assuming natural weighting (lower panel; |


The highest resolution observations show a compact source surrounded by a faint extended brightness distribution elongated roughly along the northeast-southwest direction (Fig. 1). It is noteworthy that the maximum recoverable scale (MRS;  ) is similar to the size of the extended emission in Fig. 1, which is
  above the 5σ level. Thus, the array could be filtering emission, which would prevent us from deriving reliable brightness temperatures for the star.
The continuum emission can be described by two Gaussian-like components: one compact and one extended component (Table 1). We can estimate the size of the continuum source at 7 mm at the same pulsation phase as during our observations (≃0.50) from the results reported by Matthews et al. (2018) assuming first a uniform disc fit, using linear interpolations, and finally scaling the result to obtain a Gaussian size. The result is  , smaller than the size of our compact source (
 ). This can only occur if the star is surrounded by a continuum source that emits more at 1 mm than at 7 mm, like a dusty shell (Norris et al. 2012). All this is compatible with the extended continuum component (size
  ) found by Paladini et al. (2017) in the mid-IR around the star. For simplicity, we here consider this compact component as the star.
The extended Gaussian-like component is elongated along the northeast-southwest direction. Its deconvolved size is smaller than the angular resolution provided by the C40-6 configuration ( ) and it is not evident in the corresponding map. The ellipticity of this component is e = 1 − θmin/θmaj ≃ 0.83, where θmaj and θmin are the deconvolved major and minor axes (Table 1). Because no extended emission has been discovered at longer wavelengths (Reid & Menten 2007; Matthews et al. 2018), the extended component would be produced by dust.
3.2. Complex molecular line profiles in the vicinity of the star
The CO and 29SiO lines at the central pixel reveal profiles with emission and absorption components, suggesting the presence of a complex structure (Fig. 2). The CO(v = 0, J = 2−1) and 29SiO(v = 0, J = 5 − 4) lines observed with an angular resolution  (Table 1) comprise a main emission contribution roughly centred at a systemic velocity of −0.5 km s−1 (Teyssier et al. 2006) and a prominent red-shifted absorption of ≃25% of the continuum that peaks at ≃8 km s−1. The 29SiO line observed with
  is dominated by a strong absorption peak at ≃− 2.5 km s−1 (≃70% of the continuum), while the CO line shows a clear inverse P-Cygni profile. Line CO(v = 1, J = 2 − 1) also shows a similar profile, and its absorption component peaks at ≃10 km s−1. The 29SiO(v = 1, J = 5 − 4) line lacks emission but shows a broad absorption that peaks at ≃3 − 6 km s−1. All these absorptions extend up to velocities ≃10 − 15 km s−1, higher than the terminal expansion velocity (≃6 − 9 km s−1; Bujarrabal et al. 1994; Cernicharo et al. 1997; De Beck et al. 2010; Ramstedt & Olofsson 2014). No absorption is observed for all these lines with
  and
and  , except for 29SiO(v = 1, J = 5 − 4). This line displays blue- and red-shifted absorptions and a well-differentiated, narrow emission component at the systemic velocity. The large variations seen between the v = 1 lines, which are expected to arise very close to the star and are observed with
  and
and  , indicate substantial excitation changes throughout a single pulsation period.
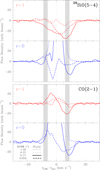 |
Fig. 2. Spectra in the central pixel of the CO(2 − 1) and 29SiO(5 − 4) lines (v = 0 in blue and v = 1 in red) acquired with different ALMA configurations. The number of pixels in the PSF is the same for every configuration. The grey vertical bands indicate the gas expansion velocity derived from single-dish observations. We have assumed a vsys = −0.5 km s−1 (Teyssier et al. 2006). |
All this suggests that (1) gas is moving away from us in front of the star, which produces the red-shifted absorptions, (2) most of the emission comes from directions that do not enclose the star, and (3) the upper level involved in the 29SiO(v = 1, J = 5 − 4) line might be strongly drained, considering that this line forms in shells with temperatures ≳1500 K, where the 29SiO(v = 0, J = 5 − 4) do show a noticeable emission. This effect could invert the populations of the levels involved in the 29SiO(v = 1, J = 6 − 5) line, which might show maser emission (Cernicharo et al. 1991; González-Alfonso & Cernicharo 1997).
3.3. Gas infall and indications of rotation
The CO and 29SiO emission distributions seen in the vicinity of the star are shown in Fig. 3. The integrated emission of line 29SiO(v = 0, J = 5 − 4) mapped with  (Fig. 3, upper left panel) shows a bipolar structure that extends roughly along the east-west direction (PA ≃ 100°). Lower level contours (≃30 − 50% of the peak emission) are elongated along the perpendicular direction. The east-west structure can be separated into different contributions in the velocity range [ − 15, 7.6] km s−1: (1) a blue-shifted contribution centred at
  to the east of the star, (2) a red-shifted contribution centred at
  to the west, and (3) another contribution at the systemic velocity covering the same region of the envelope as the previous ones. In the middle of the red- and blue-shifted contributions is an absorption in the velocity range [7.6, 15] km s−1, also seen in the 29SiO(v = 1, J = 5 − 4) line, which matches the star within the positional uncertainty.
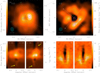 |
Fig. 3. 29SiO and CO emission in the sub-arcsec region. Upper left panel: 29SiO(v = 0, J = 5 − 4) line ( |


The division of the CO(v = 0, J = 2 − 1) line into velocity intervals reveals a more complex structure (Fig. 3, upper right panel). The emission at the systemic and positive velocities of the v = 0 and 1 lines comes from the western hemisphere of the envelope. The red-shifted absorption of the v = 0 line matches the star but it is slightly shifted towards the southwest for the v = 1 line. The blue-shifted emission of the v = 1 line is mostly absent. The blue- and red-shifted emissions of the v = 0 line and the emission of the v = 1 line overlap to the south. There is a CO emission deficit at velocities ≳3 km s−1 due northeast. The whole picture seems to be roughly symmetric around the northeast-southwest direction. This main direction is compatible with that defined by the CO(v = 0, J = 2 − 1) emission mapped with lower spatial resolutions (Fonfría et al., in prep.) and by the continuum-extended emission (Fig. 1). The position-velocity diagram along the southeast-northwest direction (Fig. 3, lower right panel) is similar to the diagrams of the rotating discs in expansion that have been found in several post-AGB stars, except for the infalling gas (Bujarrabal et al. 2016, 2017).
The disagreement between the symmetry axes in the 29SiO and CO maps could be consequence of an inhomogeneous chemistry favoured by anisotropic physical and chemical conditions. Excitation effects cannot be ruled out considering the many blended lines shown by SiO and its isotopologues that display maser emission in this and other O-rich stars (e.g. González-Alfonso & Cernicharo 1997; Pardo et al. 1998).
Two models can explain the observations reasonably well. We describe them below.
-
Gas rotating around the axis described by the extended continuum emission (northeast-southwest direction; PA ≃ 50°). Part of the gas responsible of the blue-shifted emission to the southeast would leave the main stream during its spinning movement towards the northwest as a result of instabilities or interactions with the recently ejected matter, falling onto the star with a Doppler velocity relative to the systemic velocity up to ≃10 − 15 km s−1 (Fig. 3, lower insets). The rest of the gas would continue to revolve around the star at an average velocity of ≃6 − 8 km s−1. A similar Doppler shift is expected for gas orbiting a star with a mass of ≃0.5 − 1.0 M⊙ if an orbital inclination of ≃25 ° −50° is assumed.
-
The previous rotating structure would exist as well, but there would not be any leakage resulting in gas falling onto the star. The red-shifted absorptions would be produced by radial movements of photospheric layers (or convective cells) through the stellar pulsation (Hinkle 1978; Hinkle & Barnes 1979a,b).
Contrary to what Vlemmings et al. (2017) claimed occurs in the photosphere of W Hya, where a bright spot has been suggested to be caused by the collision of infalling matter onto the star, we do not find any footprint of this phenomenon in our continuum maps. However, the angular resolution of our observations is insufficient to explore the stellar photosphere, and a similar bright spot could be highly diluted. Tatebe et al. (2008) found evidence of a hot spot in the southern part of R Leo that might have a counterpart in the millimeter range.
It can be argued that the Doppler velocities seen in our observations are related to random gas movements in the stellar photosphere or to effects of periodic shocks. Several works based on VLBI observations of SiO masers have been published for a number of AGB stars such as R Leo or TX Cam (e.g. Cotton et al. 2004; Soria-Ruiz et al. 2007; Gonidakis et al. 2013). The maser spots are assumed to live long enough to trace the gas movement very close the photosphere if a good sampling is adopted. Those observations are constrained to the shell where the maser emission is higher, which covers the region ranging from  to
to  . They thus sample a region of the envelope that is considerably closer to the star than the region traced by our data. Common conclusions are therefore difficult to draw. In contrast to VLBI observations, the angular resolution of our observations is insufficient to describe random gas movements, which are cancelled out during the averaging performed by the PSF and contribute to broaden line widths.
A set of several clumps ejected with significant axial velocities resulting from ballistic trajectories, for instance, could also be suggested to comprise the detected structure. However, our observations show a highly continuous velocity field around the star that is difficult to explain assuming randomly ejected, discrete clumps with unconnected kinematical properties. Additionally, evidence exists of a rotating molecular torus in the envelopes of other AGB stars such as L2 Pup or R Dor (Kervella et al. 2016; Homan et al. 2018). This suggests that these structures might be more common than initially expected.
The existence of rotating gas in the surroundings of the star needs an angular momentum input because the rotation of an AGB star is expected to be very low. This extra angular momentum could be provided by a dipolar magnetic field (Matt et al. 2000) or an additional body (Vlemmings et al. 2018). The first scenario would require a plasma or a gas of charged particles to be coupled with the magnetic field. No continuum emission typical of a plasma has been detected, but dust grains are probably charged in the innermost envelope. A dipolar magnetic field could force the radially ejected grains to drag the gas, which would induce circumstellar rotation. Regarding the second scenario, no companion has been found in the optical and near-IR spectral ranges (Gatewood 1992), but this disagreement could be solved if it is a small, cold body such as a low-mass star or a Jovian planet instead. This idea has been invoked by Wiesemeyer (2009) to explain the polarisation fluctuations detected in the SiO maser emission (Wiesemeyer et al. 2009), which are also formed very close to the stellar photosphere. The existence of a planet orbiting an AGB star has also been suggested to be possible by Kervella et al. (2016), who claimed to have discovered what could be one of them in L2 Pup.
4. Summary and conclusions
We presented new interferometer observations of the AGB star R Leo. They were carried out with ALMA with a maximum angular resolution of  and a MRS ≃
  .
.
The continuum emission can be described as a compact source surrounded by a highly collimated extended emission in the northeast-southwest direction. The CO maps show a  sized rotating torus-like structure with its axis lying along the northeast-southwest direction. This structure could be explained by (1) either the action of a dipolar magnetic field on the radially expanding wind or (2) the presence of a small, cold companion (maybe a Jovian planet) that orbits the central star and injects angular momentum to the gas. This seemingly rotating structure is accompanied by evident red-shifted absorptions that could be produced by infalling gas coming from it or by the regular movement of the pulsating photosphere. At larger scales, 29SiO also shows a torus-like structure with its axis roughly oriented along the north-south direction, which is not detected in the corresponding CO map. Its origin is unclear, but it may be produced by anisotropic physical and chemical conditions or unexpected excitation effects.
These observations reveal a highly complex structure in the envelope of R Leo that is tightly related to the changes undergone by this AGB star. They will be addressed accurately in the near future through detailed analyses of these and new larger-scale data.
Acknowledgments
We thank the European Research Council (ERC Grant 610256: NANOCOSMOS) and the Spanish MINECO/MICINN for funding support through grant AYA2016-75066-C-1-P and the ASTROMOL Consolider project CSD2009-00038. MA acknowledges funding support from the Ramón y Cajal program of Spanish MINECO (RyC-2014-16277). We also thank V. Bujarrabal for his valuable comments about the observation interpretation and the anonymous referee for their interesting comments.
References
- Bujarrabal, V., Fuente, A., & Omont, A. 1994, A&A, 285, 247 [NASA ADS] [Google Scholar]
- Bujarrabal, V., Castro-Carrizo, A., Alcolea, J., et al. 2016, A&A, 593, A92 [NASA ADS] [CrossRef] [EDP Sciences] [Google Scholar]
- Bujarrabal, V., Castro-Carrizo, A., Alcolea, J., et al. 2017, A&A, 597, L5 [NASA ADS] [CrossRef] [EDP Sciences] [Google Scholar]
- Castelaz, M. W., & Luttermoser, D. G. 1997, AJ, 114, 1584 [NASA ADS] [CrossRef] [Google Scholar]
- Cernicharo, J., Bujarrabal, V., & Lucas, R. 1991, A&A, 249, L27 [NASA ADS] [Google Scholar]
- Cernicharo, J., Brunswig, W., Paubert, G., & Liechti, S. 1994, ApJ, 423, L143 [NASA ADS] [CrossRef] [Google Scholar]
- Cernicharo, J., Alcolea, J., Baudry, A., & González-Alfonso, E. 1997, A&A, 319, 607 [NASA ADS] [Google Scholar]
- Cotton, W. D., Mennesson, B., Diamong, P. J., et al. 2004, A&A, 414, 275 [NASA ADS] [CrossRef] [EDP Sciences] [Google Scholar]
- De Beck, E., Decin, L., de Koter, A., et al. 2010, A&A, 523, 18 [Google Scholar]
- Fedele, D., Wittowski, M., Paresce, F., et al. 2005, A&A, 431, 1019 [NASA ADS] [CrossRef] [EDP Sciences] [Google Scholar]
- Fonfría, J. P., Fernández-López, M., Agúndez, M., et al. 2014, MNRAS, 445, 3289 [NASA ADS] [CrossRef] [Google Scholar]
- Gatewood, G. 1992, PASP, 104, 23 [NASA ADS] [CrossRef] [Google Scholar]
- González-Alfonso, E., & Cernicharo, J. 1997, A&A, 322, 938 [NASA ADS] [Google Scholar]
- González-Delgado, D., Olofsson, H., Kerschbaum, F., et al. 2003, A&A, 411, 123 [NASA ADS] [CrossRef] [EDP Sciences] [Google Scholar]
- Gonidakis, I., Diamond, P. J., & Kemball, A. J. 2013, MNRAS, 433, 3133 [NASA ADS] [CrossRef] [Google Scholar]
- Hinkle, K. H. 1978, ApJ, 220, 210 [NASA ADS] [CrossRef] [Google Scholar]
- Hinkle, K. H., & Barnes, T. G. 1979a, ApJ, 227, 923 [NASA ADS] [CrossRef] [Google Scholar]
- Hinkle, K. H., & Barnes, T. G. 1979b, ApJ, 234, 548 [NASA ADS] [CrossRef] [Google Scholar]
- Homan, W., Danilovich, T., Decin, L., et al. 2018, A&A, 614, 113 [Google Scholar]
- Kervella, P., Homan, W., Richards, A. M. S., et al. 2016, A&A, 596, A92 [NASA ADS] [CrossRef] [EDP Sciences] [Google Scholar]
- Matt, S., Balick, B., Winglee, R., & Goodson, A. 2000, ApJ, 545, 965 [NASA ADS] [CrossRef] [Google Scholar]
- Matthews, L. D., Reid, M. J., Menten, K. M., & Akiyama, K. 2018, AJ, 156, 15 [NASA ADS] [CrossRef] [Google Scholar]
- McMullin, J. P., Waters, B., Schiebel, D., Young, W., & Golap, K. 2007, in Astronomical Data Analysis Software and Systems XVI, eds. R. A. Shaw, F. Hill, & D. J. Bell, ASP Conf. Ser., 376, 127 [Google Scholar]
- Menten, K. M., Reid, M. J., Krügel, E., Claussen, M. J., & Sahai, R. 2006, A&A, 453, 301 [NASA ADS] [CrossRef] [EDP Sciences] [Google Scholar]
- Norris, B. R. M., Tuthill, P. G., Ireland, M. J., et al. 2012, Nature, 484, 220 [NASA ADS] [CrossRef] [PubMed] [Google Scholar]
- Paladini, C., Klotz, D., Sacuto, S., et al. 2017, A&A, 600, A136 [NASA ADS] [CrossRef] [EDP Sciences] [Google Scholar]
- Pardo, J. R., Cernicharo, J., González-Alfonso, E., & Bujarrabal, V. 1998, A&A, 329, 219 [NASA ADS] [Google Scholar]
- Perrin, G., Coudé du Foresto, V., Ridgway, S.T., et al. 1999, A&A, 345, 221 [Google Scholar]
- Plez, B., & Lambert, D. L. 1994, ApJ, 425, L101 [NASA ADS] [CrossRef] [Google Scholar]
- Ramstedt, S., & Olofsson, H. 2014, A&A, 566, 145 [Google Scholar]
- Reid, M. J., & Menten, K. M. 2007, ApJ, 671, 2068 [NASA ADS] [CrossRef] [Google Scholar]
- Ryde, N., Gustafsson, B., Hinkle, K. H., et al. 1999, A&A, 347, L35 [NASA ADS] [Google Scholar]
- Soria-Ruiz, R., Alcolea, J., Colomer, F., Bujarrabal, V., & Desmurs, J.-F. 2007, A&A, 468, L1 [NASA ADS] [CrossRef] [EDP Sciences] [Google Scholar]
- Tatebe, K., Wishnow, E. H., Ryan, C. S., et al. 2008, ApJ, 689, 1289 [NASA ADS] [CrossRef] [Google Scholar]
- Teyssier, D., Hernández, R., Bujarrabal, V., Yoshida, H., & Phillips, T. G. 2006, A&A, 450, 167 [NASA ADS] [CrossRef] [EDP Sciences] [Google Scholar]
- Vlemmings, W. H. T., Khouri, T., O’Gorman, E., et al. 2017, Nat. Astron., 1, 848 [NASA ADS] [CrossRef] [Google Scholar]
- Vlemmings, W. H. T., Khouri, T., De Beck, E., et al. 2018, A&A, 613, L4 [NASA ADS] [CrossRef] [EDP Sciences] [Google Scholar]
- Weiner, J., Hale, D. D. S., & Townes, C. H. 2003, ApJ, 589, 976 [NASA ADS] [CrossRef] [Google Scholar]
- Wiesemeyer, H. 2009, A&A, 501, 647 [NASA ADS] [CrossRef] [EDP Sciences] [Google Scholar]
- Wiesemeyer, H., Thum, C., Baudry, A., & Herpin, F. 2009, A&A, 498, 801 [NASA ADS] [CrossRef] [EDP Sciences] [Google Scholar]
- Wittkowski, M., Chiavassa, A., Freytag, B., et al. 2016, A&A, 587, A12 [NASA ADS] [CrossRef] [EDP Sciences] [Google Scholar]
All Tables
All Figures
|
Fig. 1. Continuum emission observed with configuration C43-9, run B, assuming natural weighting (lower panel; |
| In the text | |
|
Fig. 2. Spectra in the central pixel of the CO(2 − 1) and 29SiO(5 − 4) lines (v = 0 in blue and v = 1 in red) acquired with different ALMA configurations. The number of pixels in the PSF is the same for every configuration. The grey vertical bands indicate the gas expansion velocity derived from single-dish observations. We have assumed a vsys = −0.5 km s−1 (Teyssier et al. 2006). |
| In the text | |
|
Fig. 3. 29SiO and CO emission in the sub-arcsec region. Upper left panel: 29SiO(v = 0, J = 5 − 4) line ( |
| In the text | |
Current usage metrics show cumulative count of Article Views (full-text article views including HTML views, PDF and ePub downloads, according to the available data) and Abstracts Views on Vision4Press platform.
Data correspond to usage on the plateform after 2015. The current usage metrics is available 48-96 hours after online publication and is updated daily on week days.
Initial download of the metrics may take a while.