Fig. 7.
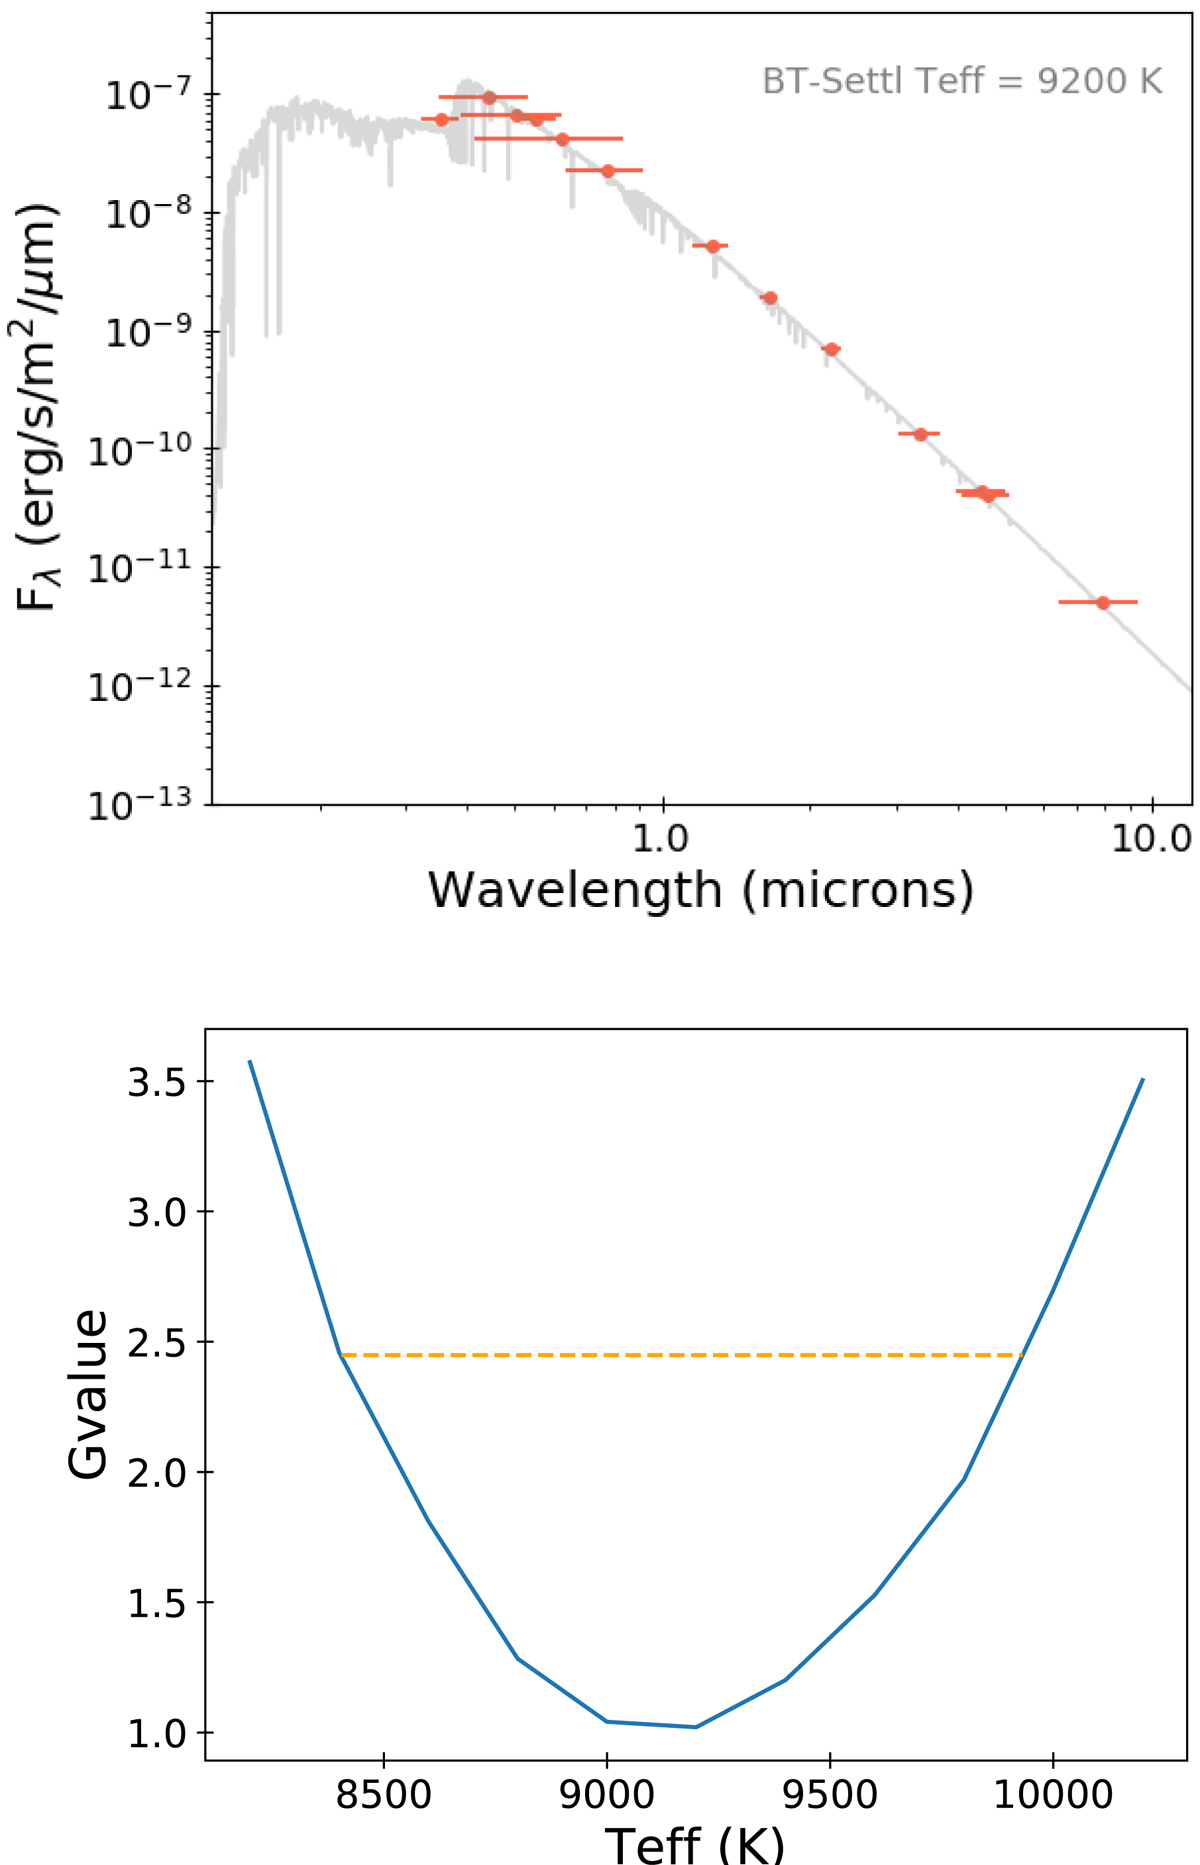
Spectral energy distribution (SED) of the primary HIP 79124 A0V star. Top panel: a BT-Settl model (Allard et al. 2012) of Teff = 9200 K and log g = 4.5 dex is fitted to the flux values at ≤10 μm compiled from the literature (see Table 4). Bottom panel: G-value (Cushing et al. 2008) for BT-Settl models with different Teff. The orange dashed line shows the upper limit for the considered well-fitting models.
Current usage metrics show cumulative count of Article Views (full-text article views including HTML views, PDF and ePub downloads, according to the available data) and Abstracts Views on Vision4Press platform.
Data correspond to usage on the plateform after 2015. The current usage metrics is available 48-96 hours after online publication and is updated daily on week days.
Initial download of the metrics may take a while.