Fig. 3.
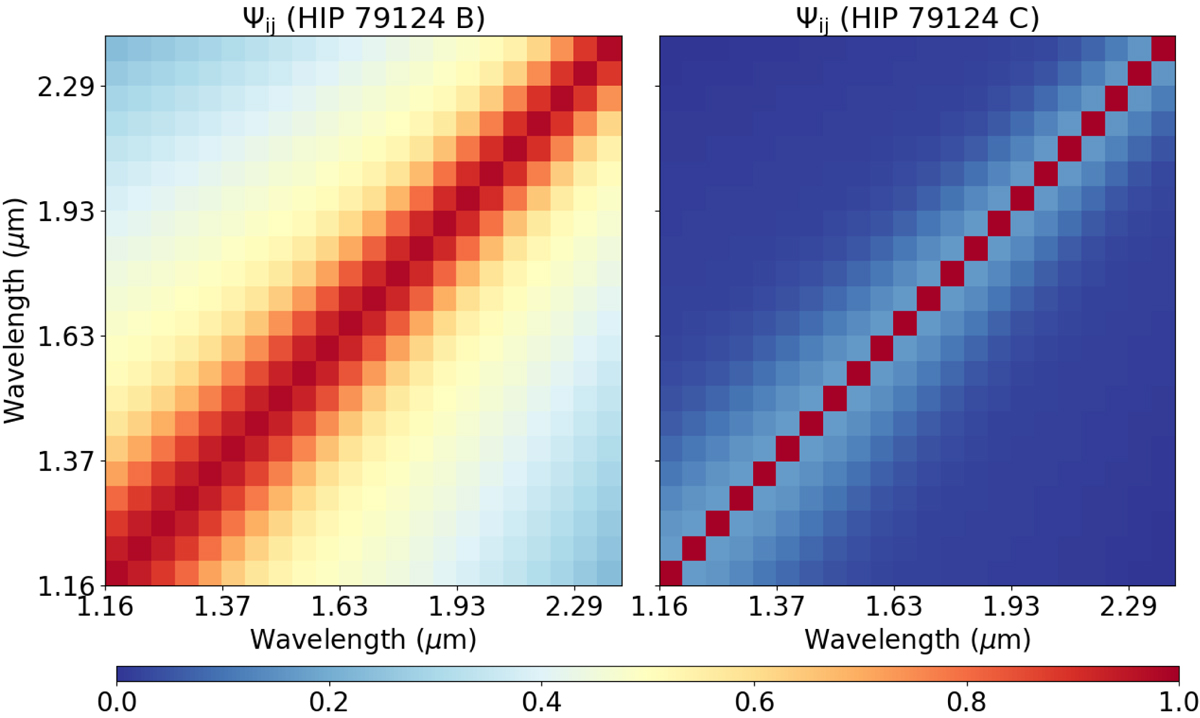
Correlation matrices calculated via Eq. (1) for the B (left panel) and C (right panel) companions to HIP 79124 A. The reduction process of the IFS data introduced spectrally correlated noise in the extracted spectra. The small projected separation at which B is located makes the noise to be highly-correlated, as the speckles from the primary PSF add flux density within the companion’s PSF over different channels.
Current usage metrics show cumulative count of Article Views (full-text article views including HTML views, PDF and ePub downloads, according to the available data) and Abstracts Views on Vision4Press platform.
Data correspond to usage on the plateform after 2015. The current usage metrics is available 48-96 hours after online publication and is updated daily on week days.
Initial download of the metrics may take a while.