Fig. B.1.
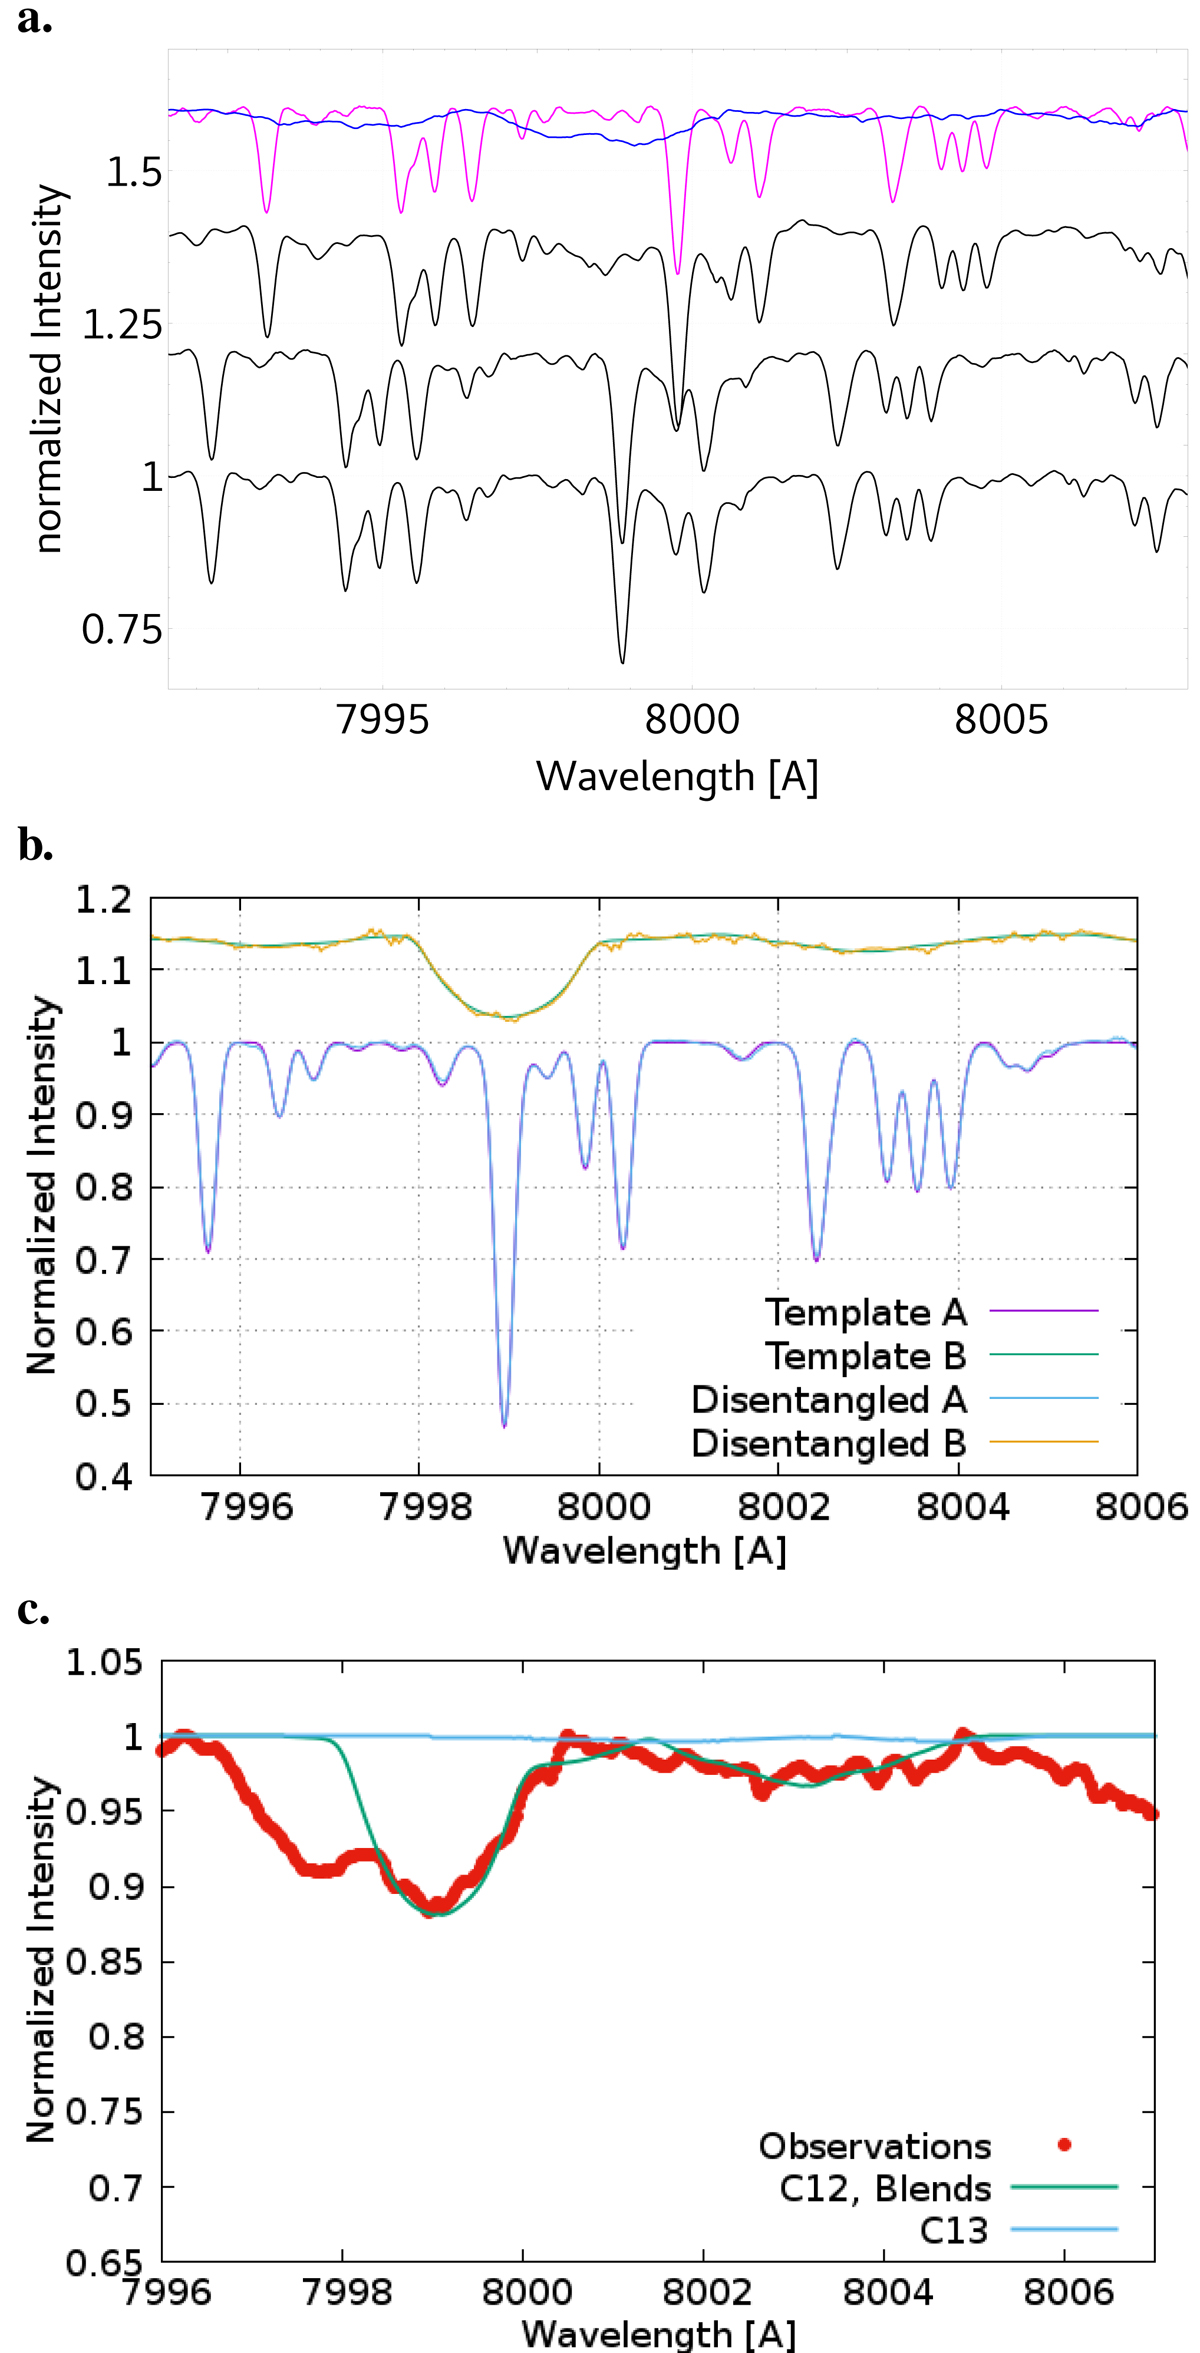
Panel a: three selected observations (each shifted on y by 0.2 for better visibility) with the weakest telluric feature (black) and the separated spectra (purple and blue) from these observations. The separated spectra are shifted in wavelength to match the topmost observation. The separated spectra are scaled such that the line strength matches the strengths in the observations. Panel b: synthetic spectra (used as templates to create an artifical binary data set) in comparison with the separated spectra (see text). Panel c: separated spectrum (red) of the G0III secondary of Capella with a synthetic spectrum (green). This was derived with the stellar parameters as listed in Table 2 and the line list given in Table B.1. It shows predominantly only the strong Fe I 7999 Å line. The blue line is a synthetic spectrum based on the 13CN lines as with an abundance as derived for the primary.
Current usage metrics show cumulative count of Article Views (full-text article views including HTML views, PDF and ePub downloads, according to the available data) and Abstracts Views on Vision4Press platform.
Data correspond to usage on the plateform after 2015. The current usage metrics is available 48-96 hours after online publication and is updated daily on week days.
Initial download of the metrics may take a while.