Free Access
Fig. A.1.
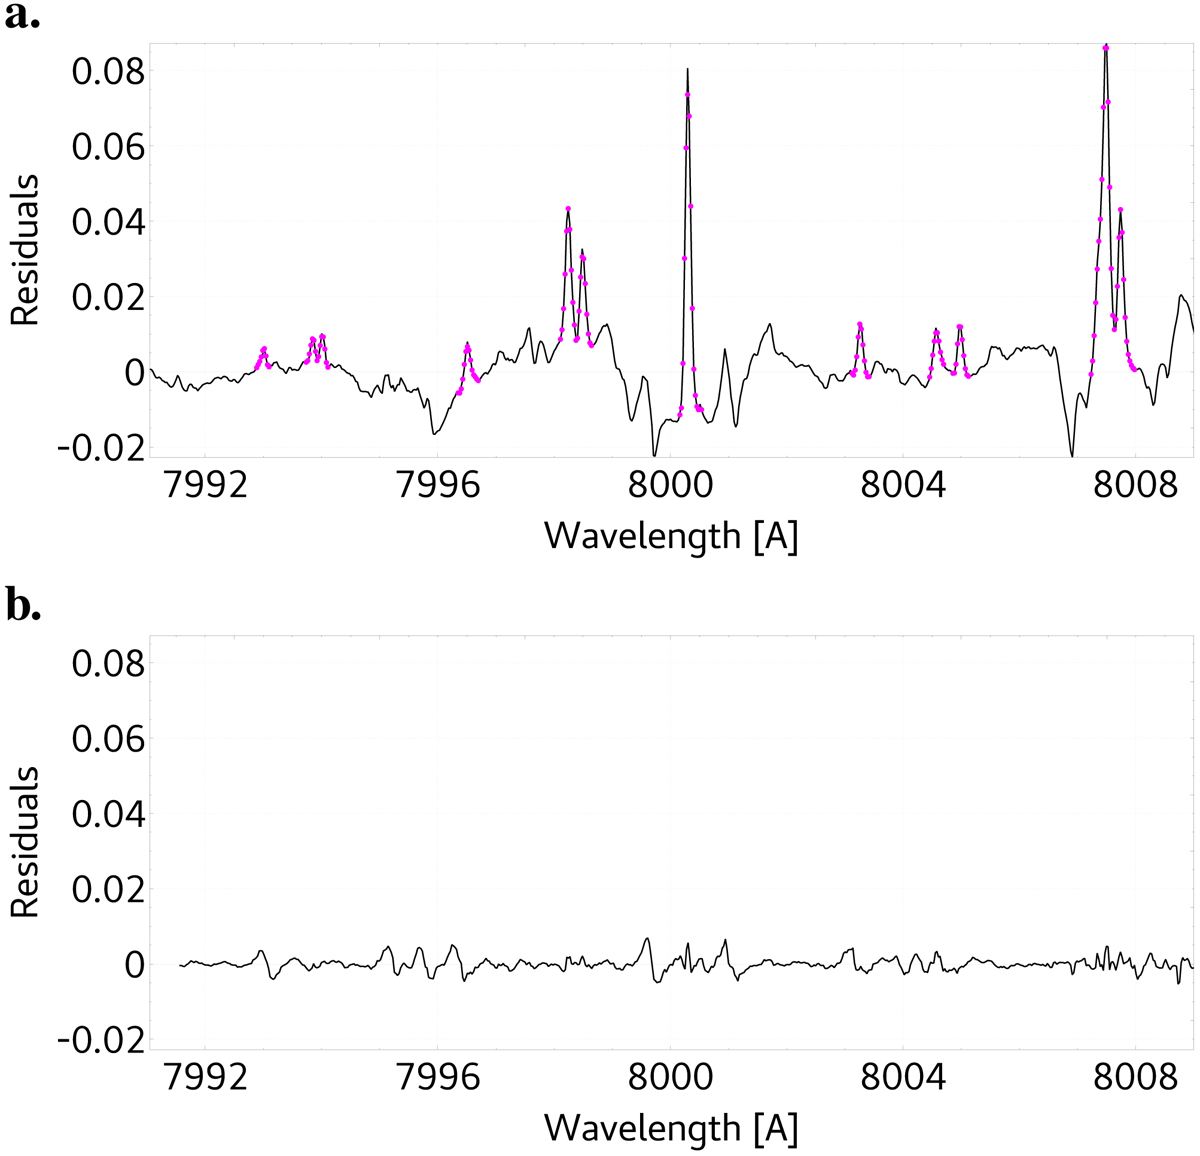
Residual spectrum between separated spectra of the two components and an observation with strong telluric lines. Panel a: residuals before correction. The dots represent the spline used to approximate the telluric lines. Panel b: residuals to the final corrected spectrum.
Current usage metrics show cumulative count of Article Views (full-text article views including HTML views, PDF and ePub downloads, according to the available data) and Abstracts Views on Vision4Press platform.
Data correspond to usage on the plateform after 2015. The current usage metrics is available 48-96 hours after online publication and is updated daily on week days.
Initial download of the metrics may take a while.