Fig. 4.
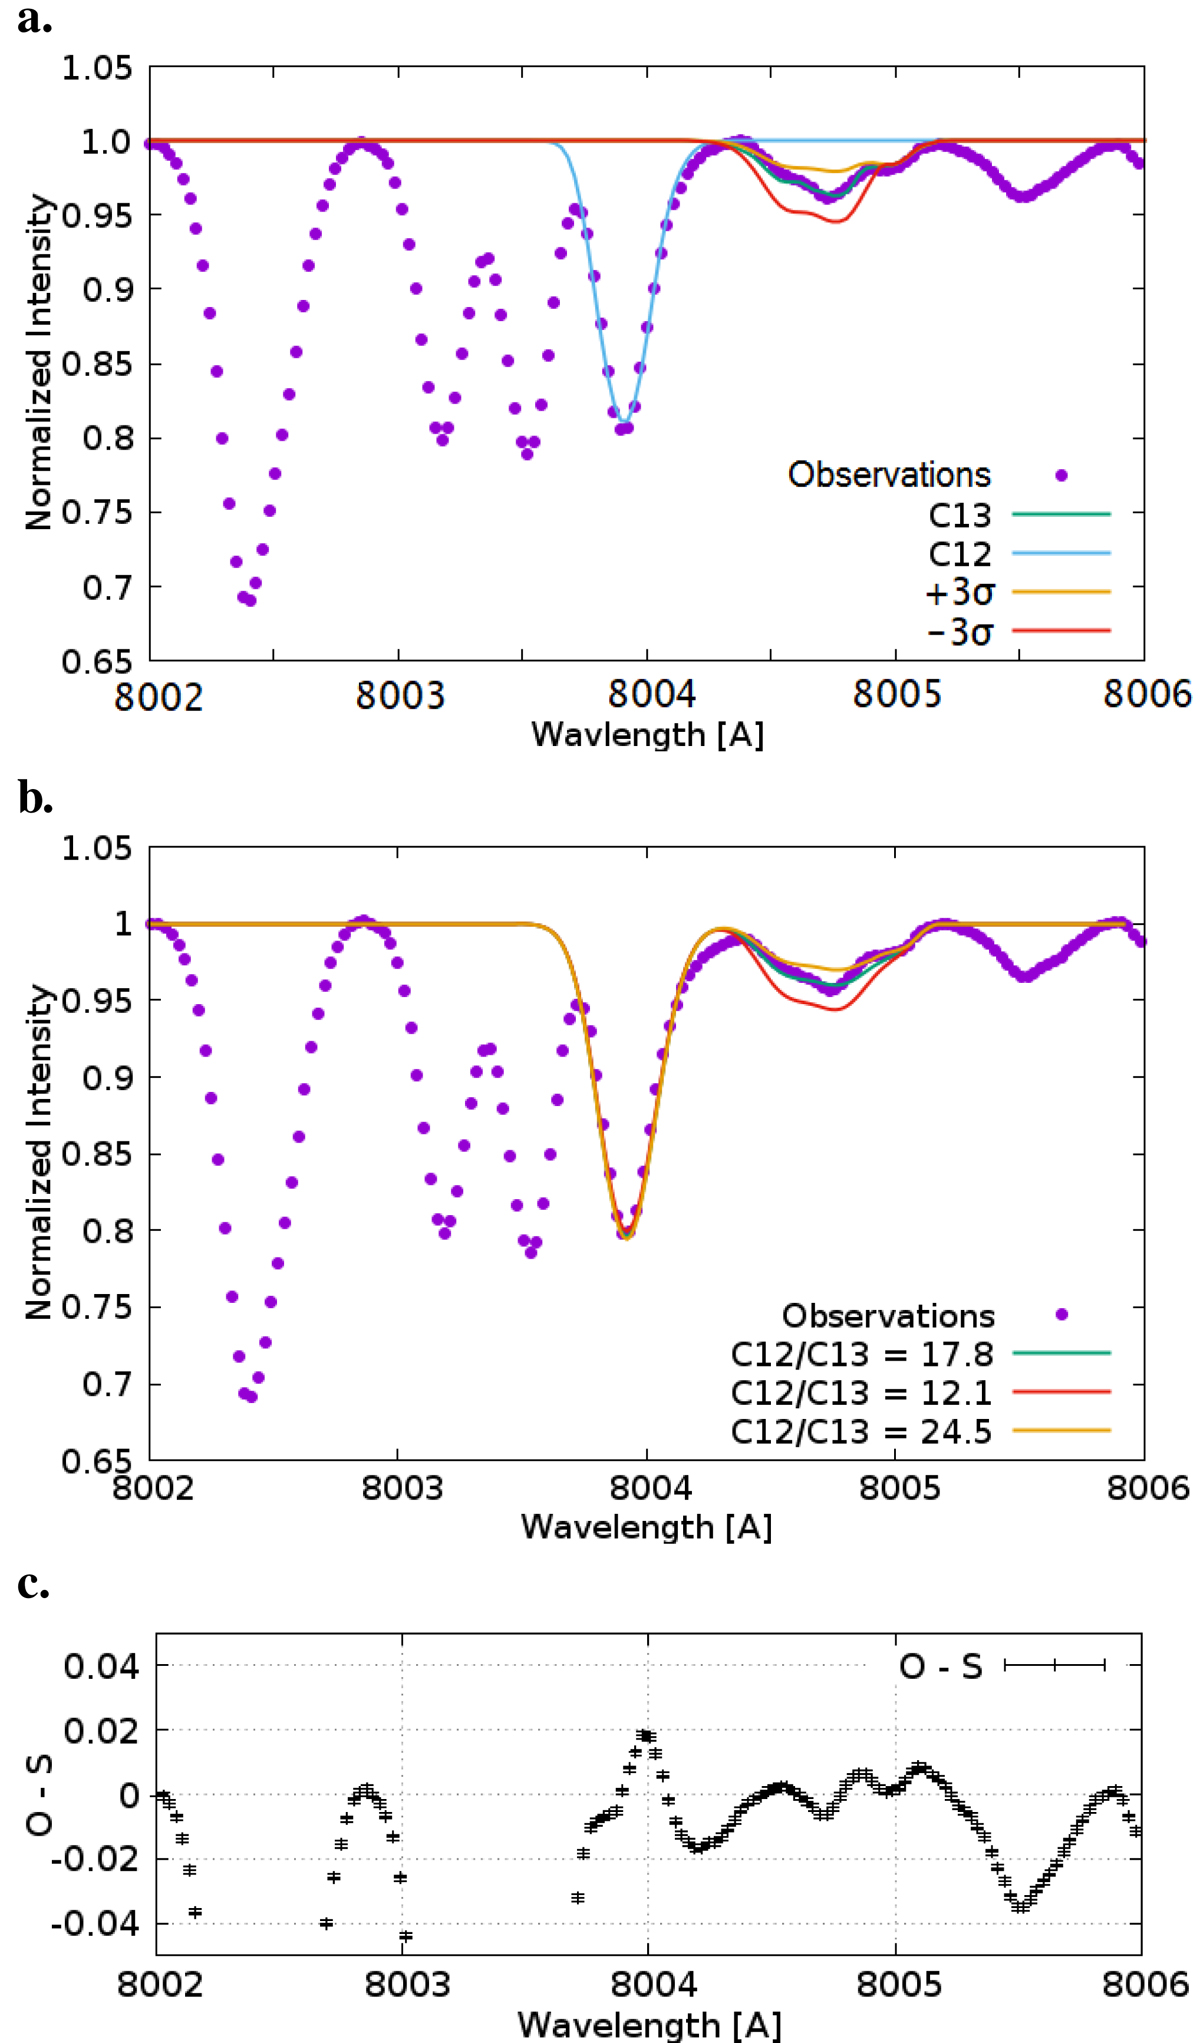
Panel a: result from the spectrum synthesis fitting with SME. The observations are shown as dots, and we plot the best fits as blue and green lines for the 12CN and 13CN line region, respectively. This suggests an isotope ratio of 17.8 ± 1.9. The synthetic spectra for ±3σ deviations are shown as orange and red lines, respectively. Panel b: spectrum synthesis with MOOG for consistency of the spectral fitting by SME. See text for the parameters of the underlying MARCS model. Panel c: observations minus synthesis (O-S) for the MOOG synthesis. Error bars corresponds to an S/N of 1000.
Current usage metrics show cumulative count of Article Views (full-text article views including HTML views, PDF and ePub downloads, according to the available data) and Abstracts Views on Vision4Press platform.
Data correspond to usage on the plateform after 2015. The current usage metrics is available 48-96 hours after online publication and is updated daily on week days.
Initial download of the metrics may take a while.