Free Access
Fig. 2.
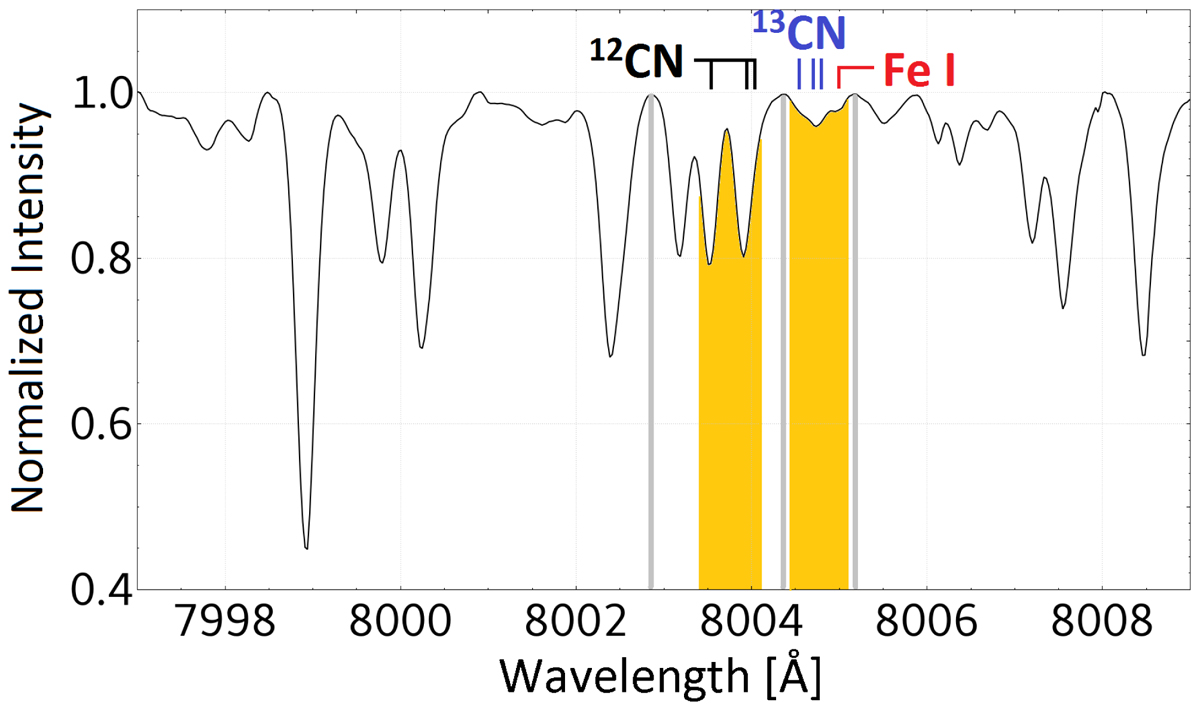
Separated spectra of the G8III primary for the 8004 Å wavelength region of Capella. Light gray vertical lines define three continuum points, and the orange regions indicate the two fit regions for the spectrum synthesis.
Current usage metrics show cumulative count of Article Views (full-text article views including HTML views, PDF and ePub downloads, according to the available data) and Abstracts Views on Vision4Press platform.
Data correspond to usage on the plateform after 2015. The current usage metrics is available 48-96 hours after online publication and is updated daily on week days.
Initial download of the metrics may take a while.