Fig. 1.
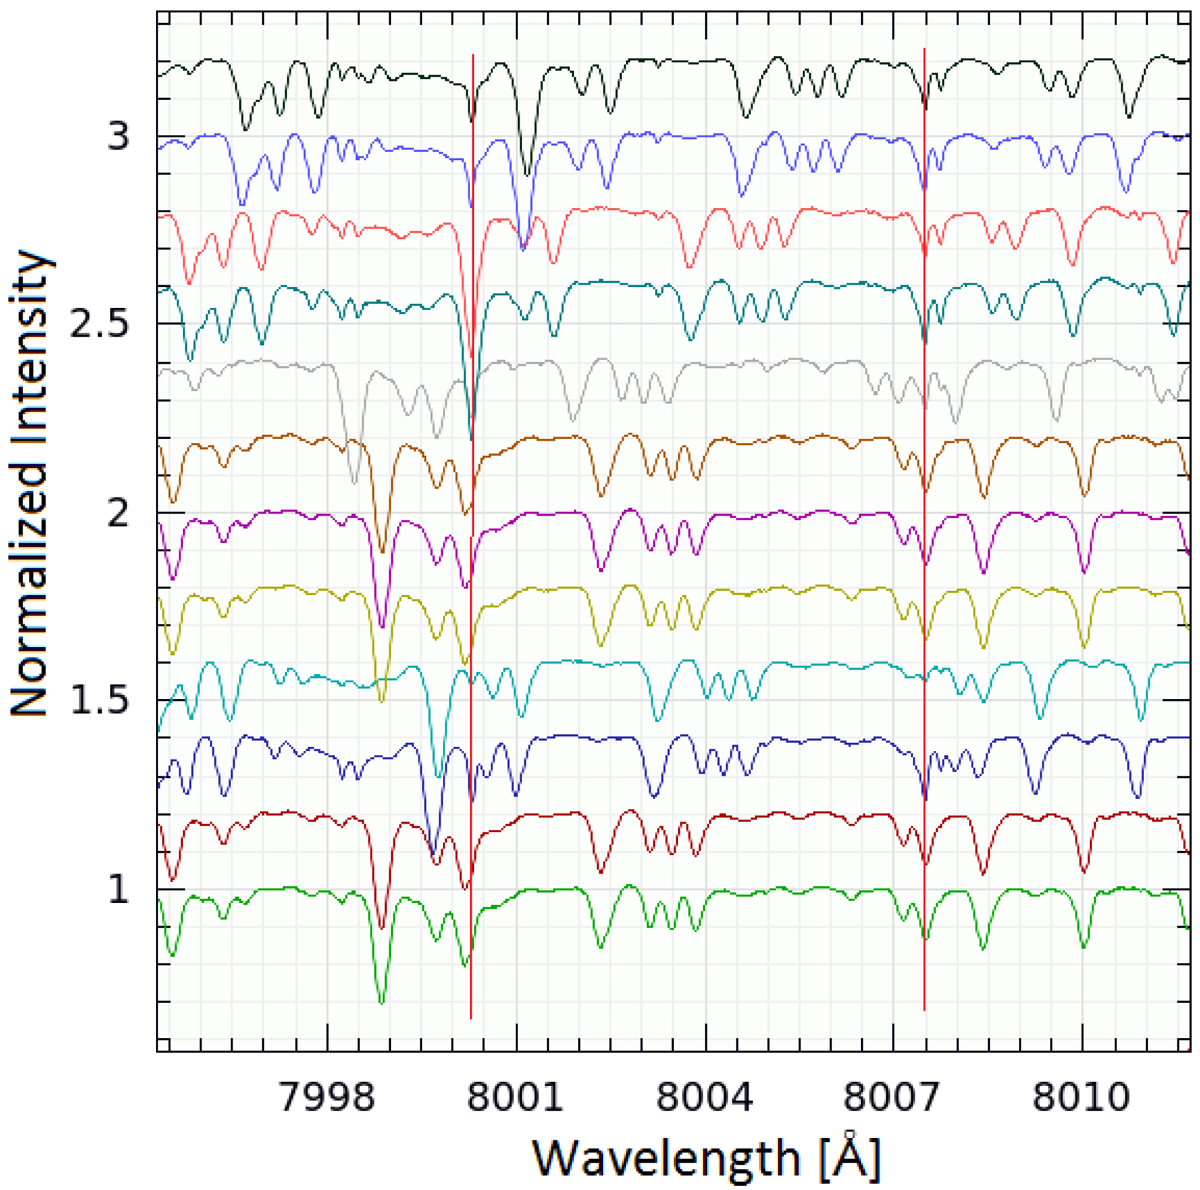
Twelve Capella spectra that were used for the disentanglement. The bottom spectrum is the first spectrum listed in Table 1. The others are shifted in intensity by +0.2 for better visibility. The spectra are shown in laboratory wavelength scale (prior to heliocentric correction), and some telluric features are marked with vertical red lines.
Current usage metrics show cumulative count of Article Views (full-text article views including HTML views, PDF and ePub downloads, according to the available data) and Abstracts Views on Vision4Press platform.
Data correspond to usage on the plateform after 2015. The current usage metrics is available 48-96 hours after online publication and is updated daily on week days.
Initial download of the metrics may take a while.