Fig. 7.
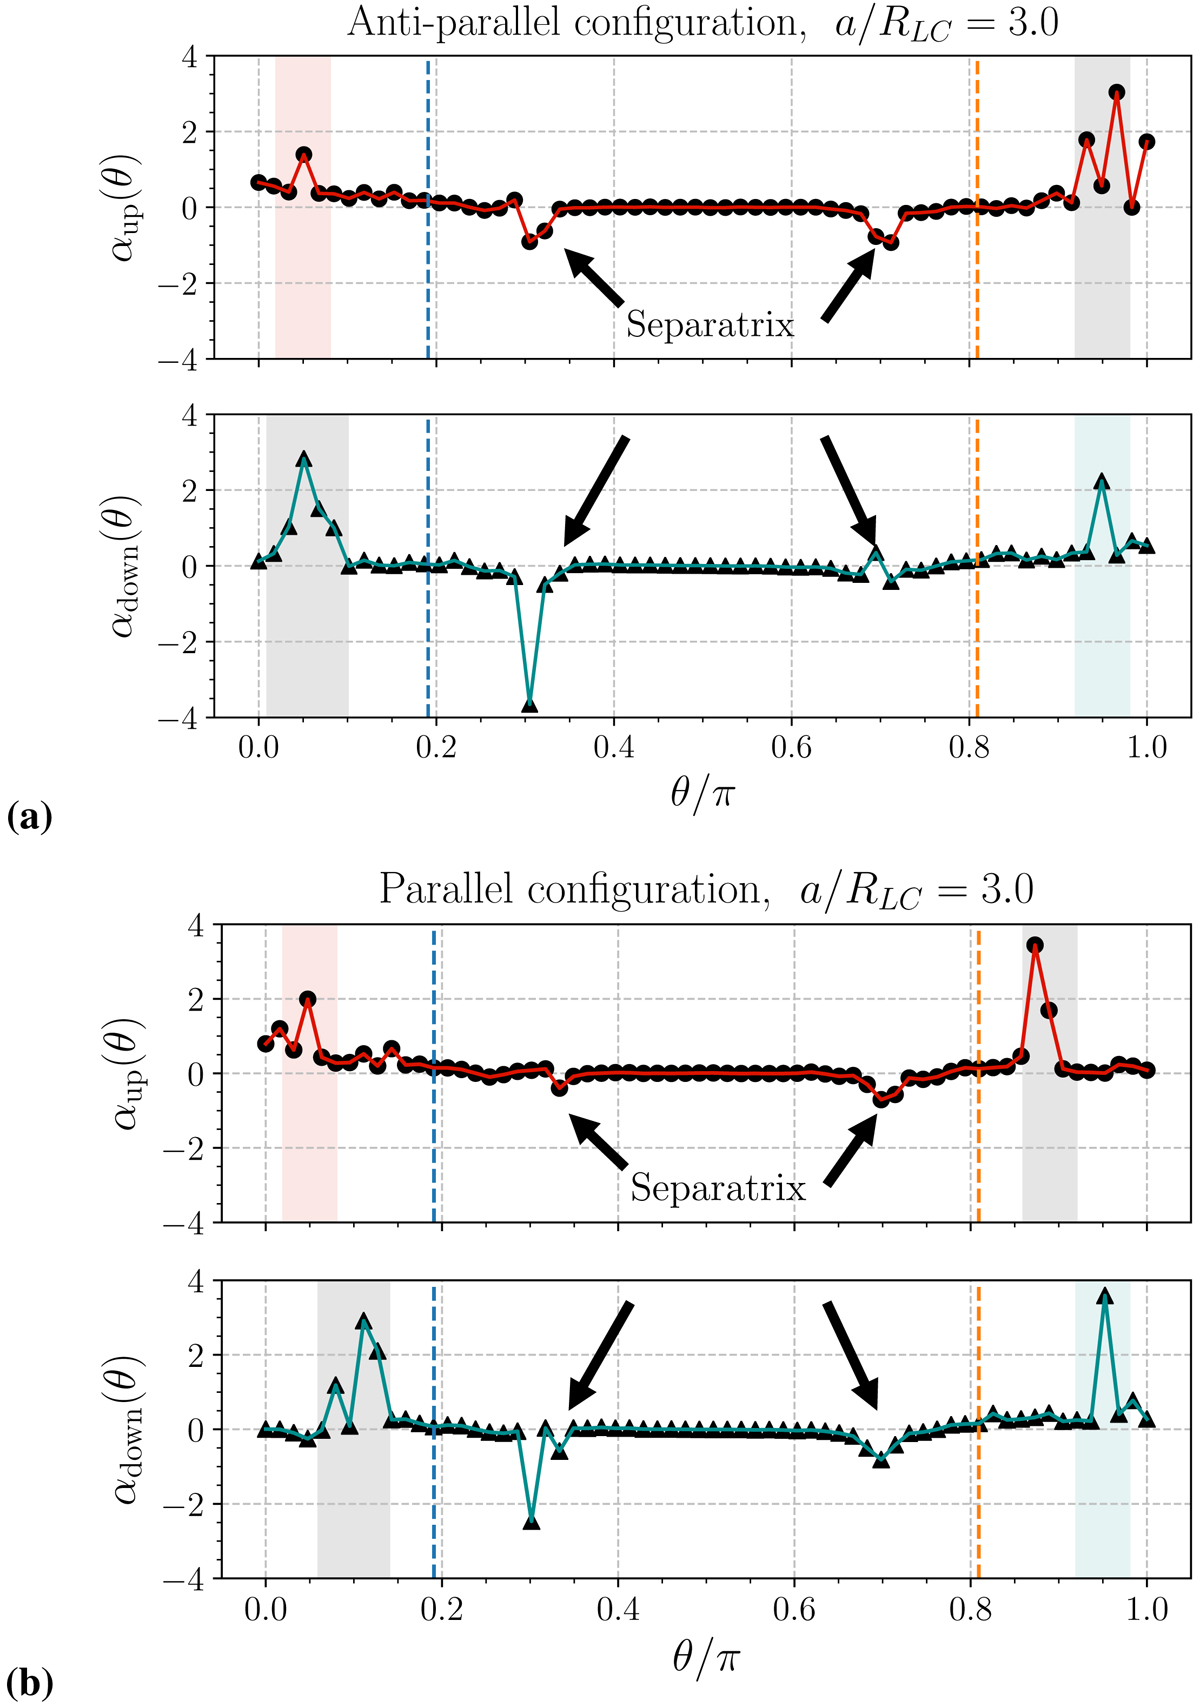
Plots of α(θ) = Jr(R0, θ)/cρGJ in the parallel (panel a) and anti-parallel (panel b) configurations, for the top (top panel) and bottom (bottom panel) pulsars. The stellar distance is fixed at a = 3 RLC. The dashed lines mark the locations of θpc and π − θpc (see Eq. (12)). The grey-shaded zones indicate the inward pole regions of emission, and the color-shaded zones mark the outward pole emission.
Current usage metrics show cumulative count of Article Views (full-text article views including HTML views, PDF and ePub downloads, according to the available data) and Abstracts Views on Vision4Press platform.
Data correspond to usage on the plateform after 2015. The current usage metrics is available 48-96 hours after online publication and is updated daily on week days.
Initial download of the metrics may take a while.