Fig. 3.
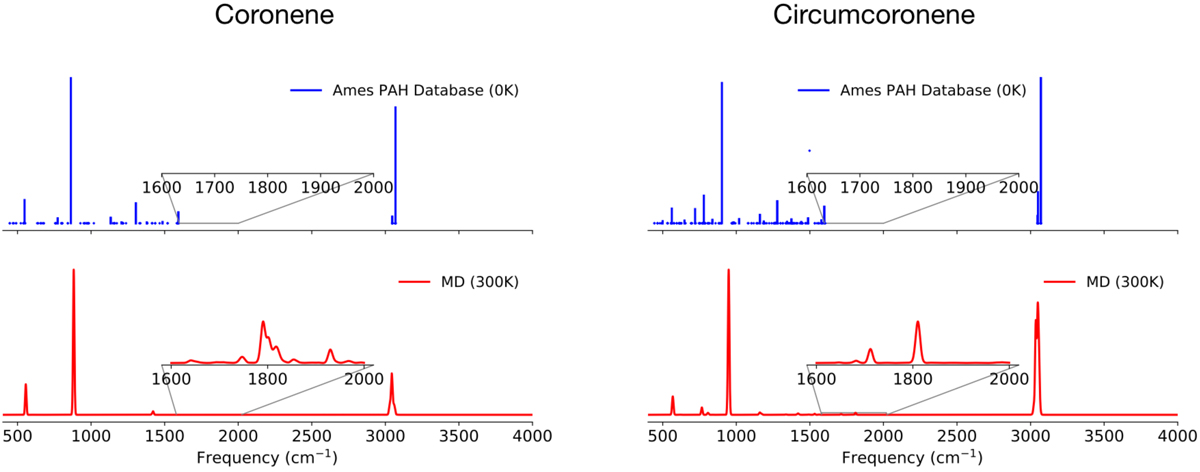
Comparison between harmonic (top panels) and anharmonic (bottom panels) IR spectra of coronene (left panels) and circumcoronene (right panels). The harmonic spectra are downloaded from NASA Ames PAH Database, and multiple scaling factors are multiplied to correct the anharmonic effects (Bauschlicher et al. 2018). The anharmonic spectra are calculated at 300 K with semiempirical method of PM3. The insets show the region of combination bands, where anharmonicity and resonances dominate.
Current usage metrics show cumulative count of Article Views (full-text article views including HTML views, PDF and ePub downloads, according to the available data) and Abstracts Views on Vision4Press platform.
Data correspond to usage on the plateform after 2015. The current usage metrics is available 48-96 hours after online publication and is updated daily on week days.
Initial download of the metrics may take a while.