Fig. 4.
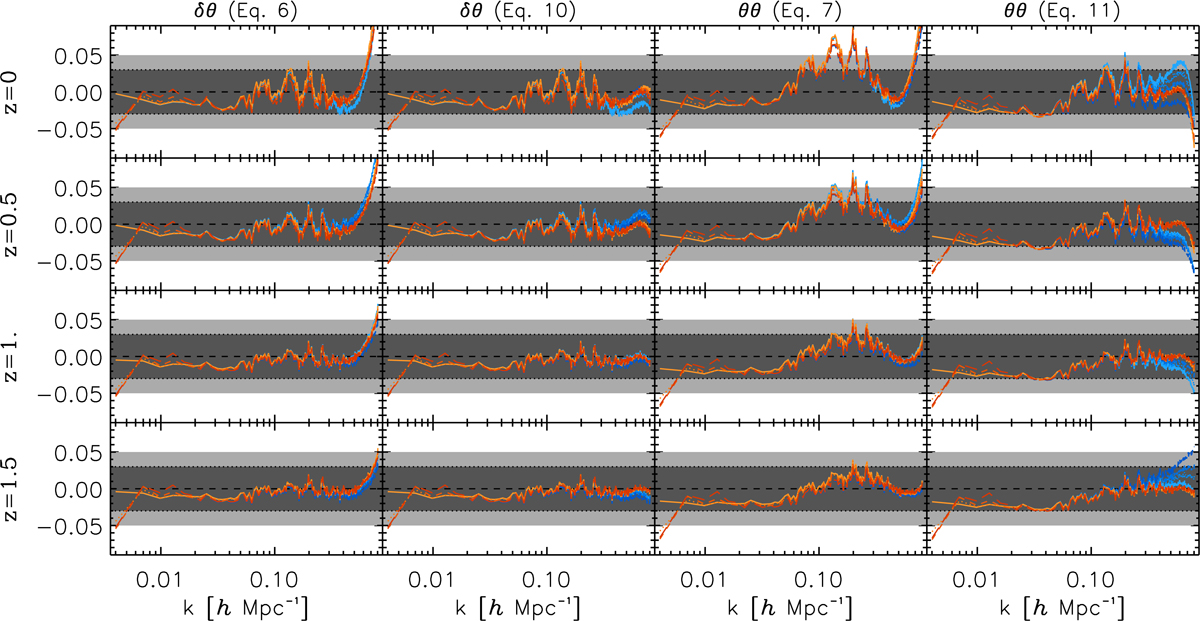
Fractional deviation of the measured velocity spectra from our best-fitting models. Different rows mark different redshifts as specified on the left of the panels. The first and third columns show the fit of Pδθ using Eq. (6), and the fit of Pθθ using Eq. (7). The second and fourth columns show results corresponding to Eqs. (10) and (11). The black dashed line marks the 0, while the light/dark gray bands represent the 5%/3% deviations from the measurements. Finally, the red shaded color shows the results for various neutrino masses (darker when increasing the neutrino mass) using the fitted shape parameters while the blue shaded lines show the results when using the fitted dependance of the shape parameters with respect to σ8, m (see Eq. (12)).
Current usage metrics show cumulative count of Article Views (full-text article views including HTML views, PDF and ePub downloads, according to the available data) and Abstracts Views on Vision4Press platform.
Data correspond to usage on the plateform after 2015. The current usage metrics is available 48-96 hours after online publication and is updated daily on week days.
Initial download of the metrics may take a while.