Fig. 3.
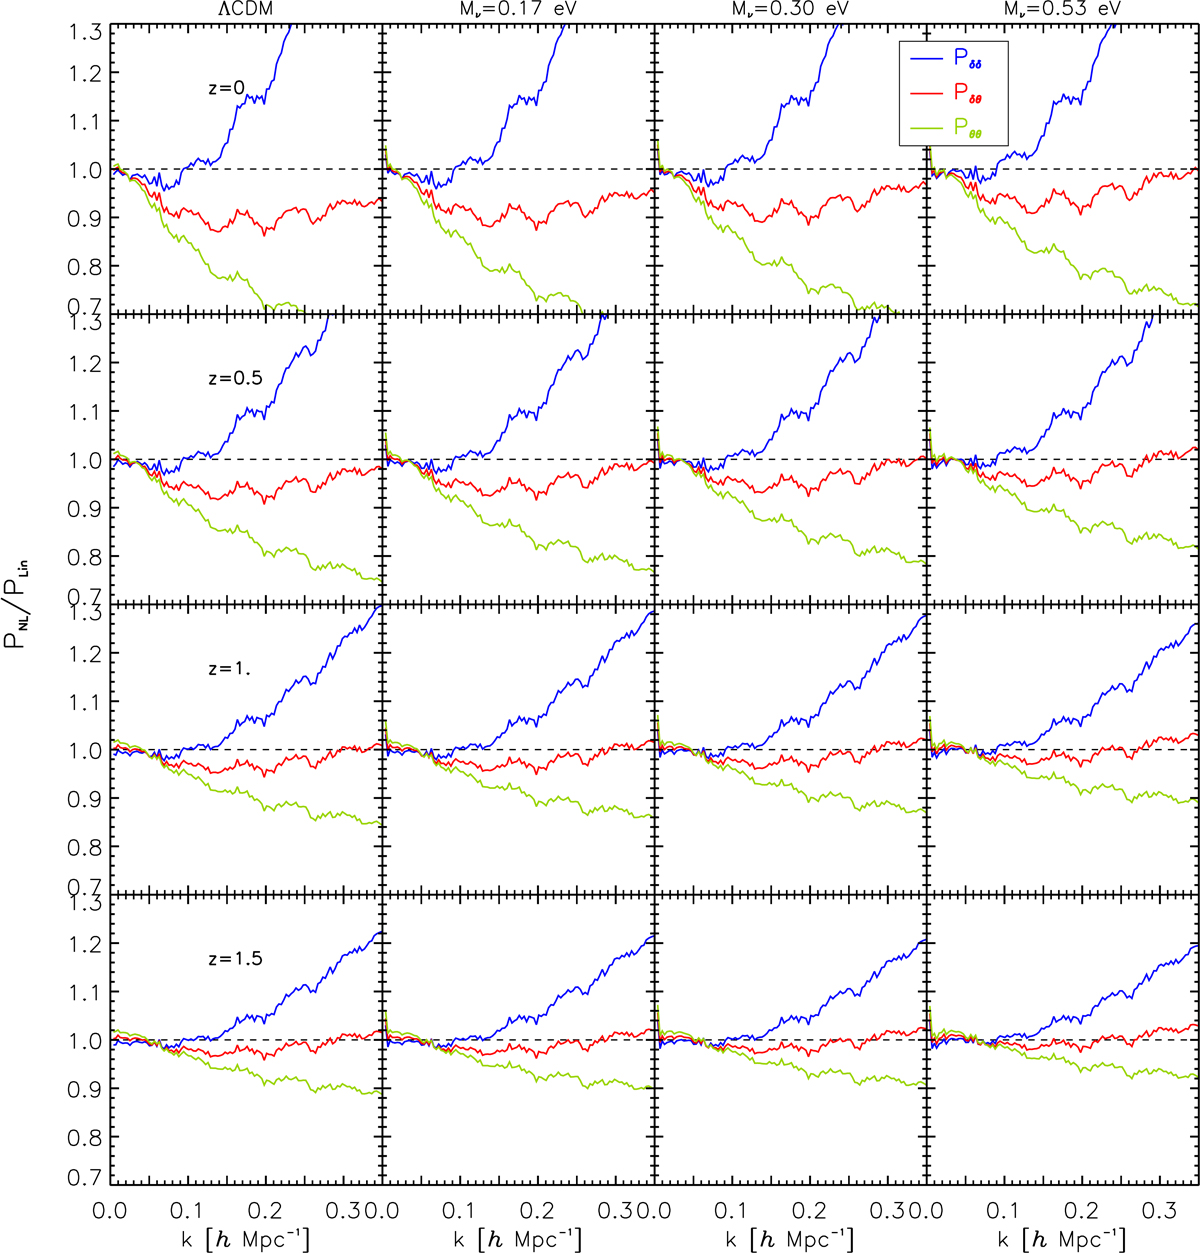
Ratio between nonlinear (measured) PNL and the linear (predicted) PLin power spectra in the ΛCDM case (∑mν = 0) and for the three neutrino masses (∑mν = {0.17, 0.3, 0.53} eV). The density–density, density–velocity divergence, and velocity divergence–velocity divergence spectra are represented by blue solid, red short dashed, and green long dashed lines, respectively. Each row shows the redshift evolution of these ratios (from top to bottom panels: z = 0, 0.5, 1. and 1.5.)
Current usage metrics show cumulative count of Article Views (full-text article views including HTML views, PDF and ePub downloads, according to the available data) and Abstracts Views on Vision4Press platform.
Data correspond to usage on the plateform after 2015. The current usage metrics is available 48-96 hours after online publication and is updated daily on week days.
Initial download of the metrics may take a while.