Fig. 1.
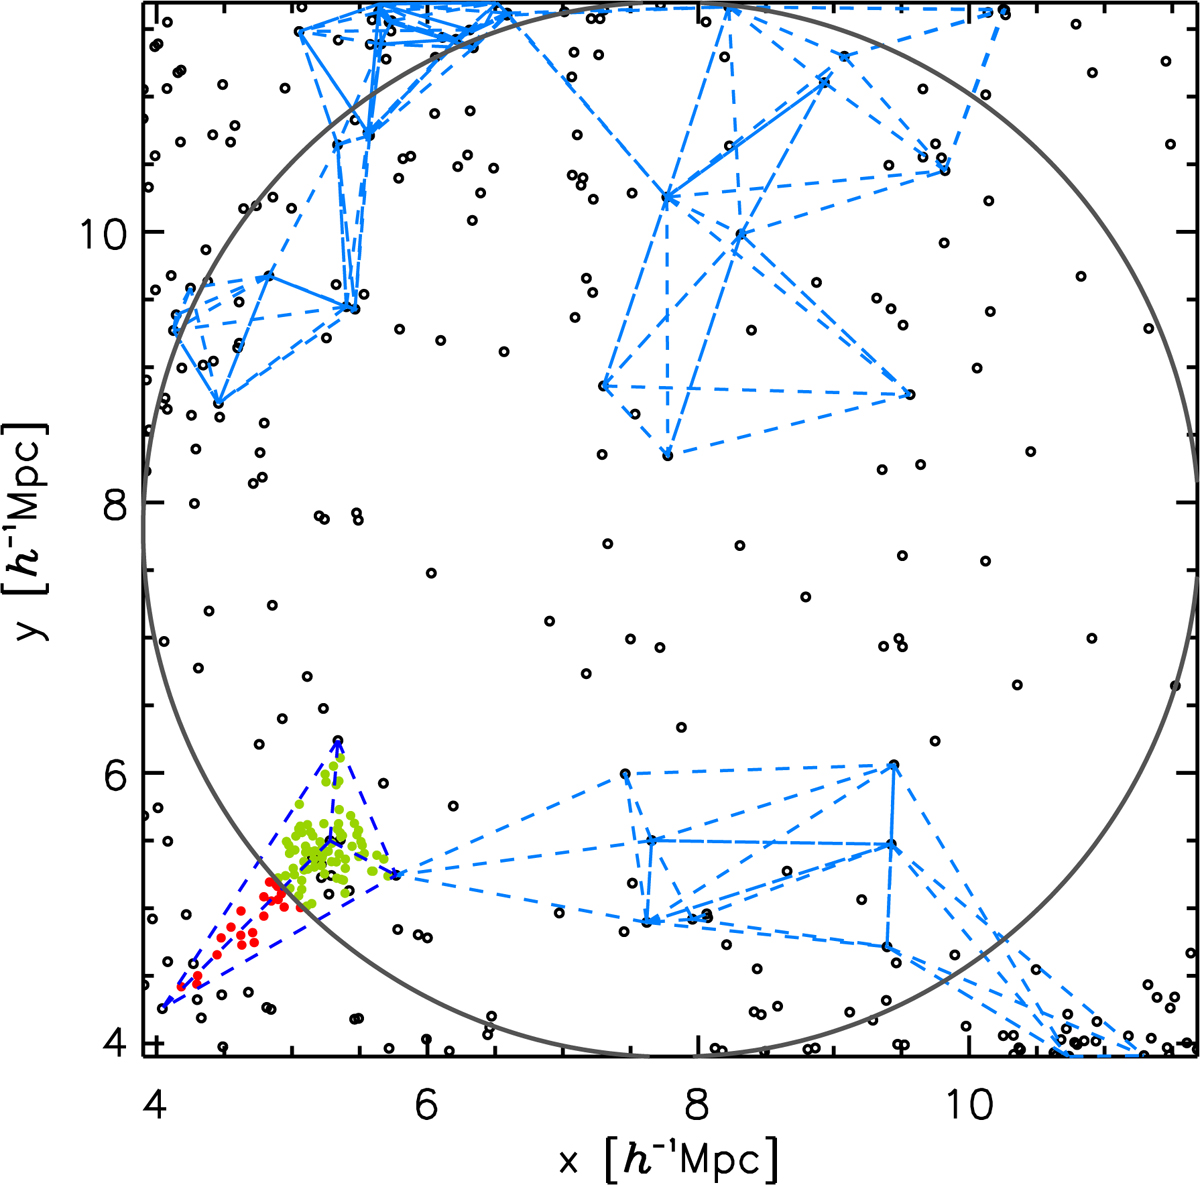
Tetrahedra in a spherical cell: the empty circles represent the 3D distribution of CDM particles in a cubic region of size 8 h−1 Mpc projected in 2D. They represent the input set of points on which we perform the Delaunay tessellation. The gray circle represents the spherical cell. For clarity, we only show, in dashed light blue lines, the tetrahedra which have their four vertices included in a slice of 1.5 h−1 Mpc (in the z-direction) around the center of the cell. As an example we highlight one tetrahedron overlapping the boundary of the spherical cell (dark blue in the bottom left-hand corner). The red and green filled circles represent the randomly distributed points over the tetrahedron, the green ones represent those points lying inside the spherical cell and that are then used to assign a velocity to the corresponding region of the tetrahedron. This is repeated for all tetrahedrons of the tessellation that overlap the boundary of the spherical cell.
Current usage metrics show cumulative count of Article Views (full-text article views including HTML views, PDF and ePub downloads, according to the available data) and Abstracts Views on Vision4Press platform.
Data correspond to usage on the plateform after 2015. The current usage metrics is available 48-96 hours after online publication and is updated daily on week days.
Initial download of the metrics may take a while.