Fig. 7
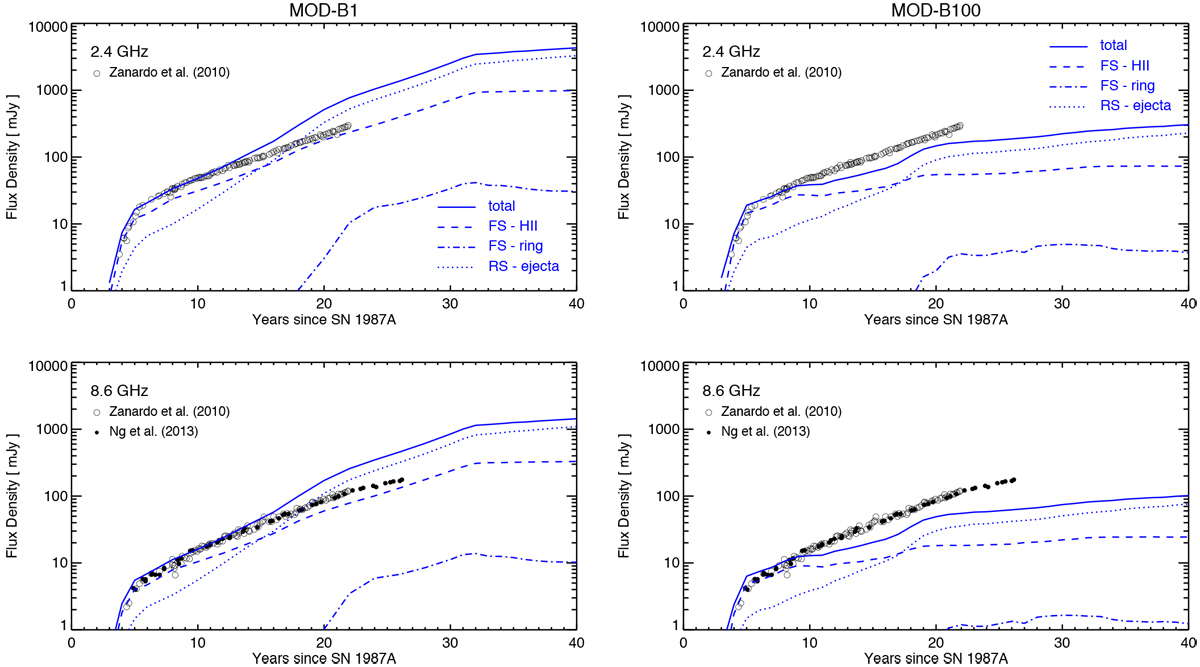
Synthetic radio flux densities (lines) for models MOD-B1 (left panels) and Mod-B100 (right panels) plotted against the observed values (symbols) at 2.4 GHz (upper panels; Zanardo et al. 2010) and 8.6 GHz (lower panels; Zanardo et al. 2010; Ng et al. 2013). The figure shows the synthetic lightcurves (solid lines), the contribution to emission from the forwardshock traveling through the H II region (dashed lines) and through the ring (dot-dashed lines), and the contributionfrom the reverse shock traveling through the ejecta (dotted lines).
Current usage metrics show cumulative count of Article Views (full-text article views including HTML views, PDF and ePub downloads, according to the available data) and Abstracts Views on Vision4Press platform.
Data correspond to usage on the plateform after 2015. The current usage metrics is available 48-96 hours after online publication and is updated daily on week days.
Initial download of the metrics may take a while.