Fig. 6
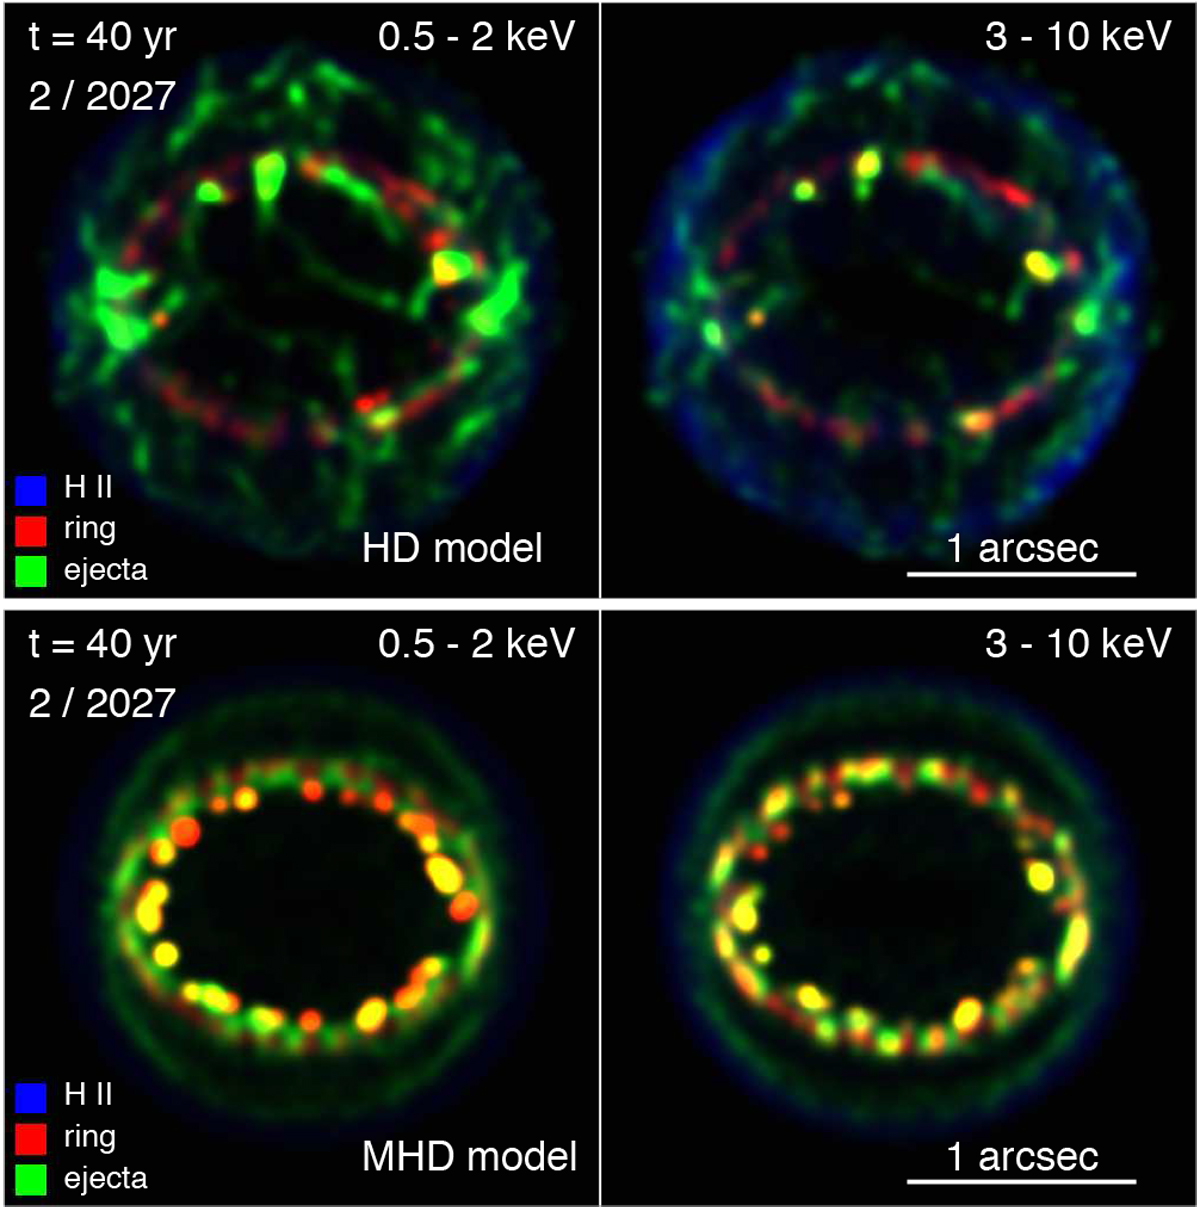
Three-color composite images of the X-ray emission in the soft bands ([0.5, 2] keV; left panels) and hard bands ([3, 10] keV; right panels) integrated along the LoS at year 40 for the HD model of Orlando et al. (2015; upper panels) and for the MHD modelMOD-B1 (lower panels). Each image has been normalized to its maximum for visibility and smoothed with a Gaussian 0.025 arcsec in size. The colors in the composite show the contribution to emission from the different shocked plasma components, namely the ejecta (green), the ring (red), and the H II region (blue); yellow regions result from the combinationof red and green.
Current usage metrics show cumulative count of Article Views (full-text article views including HTML views, PDF and ePub downloads, according to the available data) and Abstracts Views on Vision4Press platform.
Data correspond to usage on the plateform after 2015. The current usage metrics is available 48-96 hours after online publication and is updated daily on week days.
Initial download of the metrics may take a while.