Fig. 5
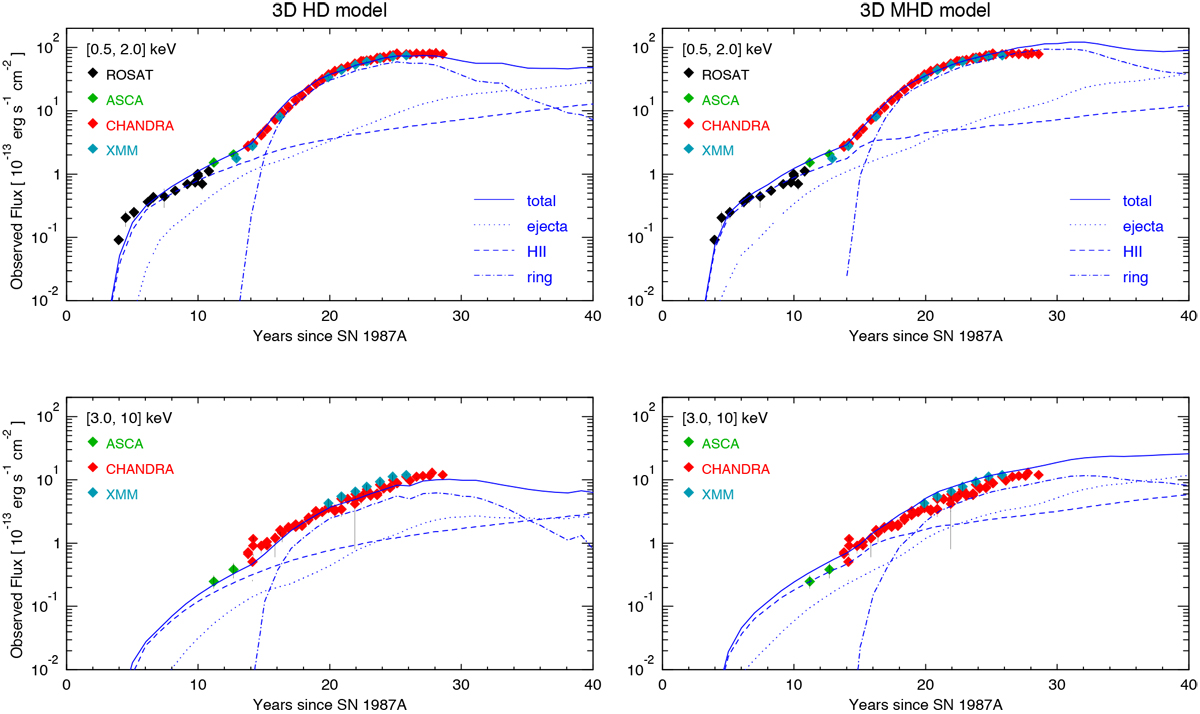
Comparison between observed (symbols) and synthetic (lines) X-ray lightcurves in the [0.5, 2] keV (upper panels) and [3, 10] keV (lower panels) bands for the best-fit HD model of Orlando et al. (2015; left panels) and for the MHD model MOD-B1 presented here (right panels). Solid lines show the synthetic lightcurves; dotted, dashed, and dot-dashed lines indicate the contributionto emission from the shocked ejecta, the shocked plasma from the H II region, and the shocked plasma from the ring, respectively; the different symbols show the fluxes measured with Rosat (black diamonds; Haberl et al. 2006), ASCA (green; Orlando et al. 2015), Chandra (red; Helder et al. 2013; Frank et al. 2016), and XMM-Newton (cyan; Haberl et al. 2006; Maggi et al. 2012; Orlando et al. 2015).
Current usage metrics show cumulative count of Article Views (full-text article views including HTML views, PDF and ePub downloads, according to the available data) and Abstracts Views on Vision4Press platform.
Data correspond to usage on the plateform after 2015. The current usage metrics is available 48-96 hours after online publication and is updated daily on week days.
Initial download of the metrics may take a while.