Fig. 2
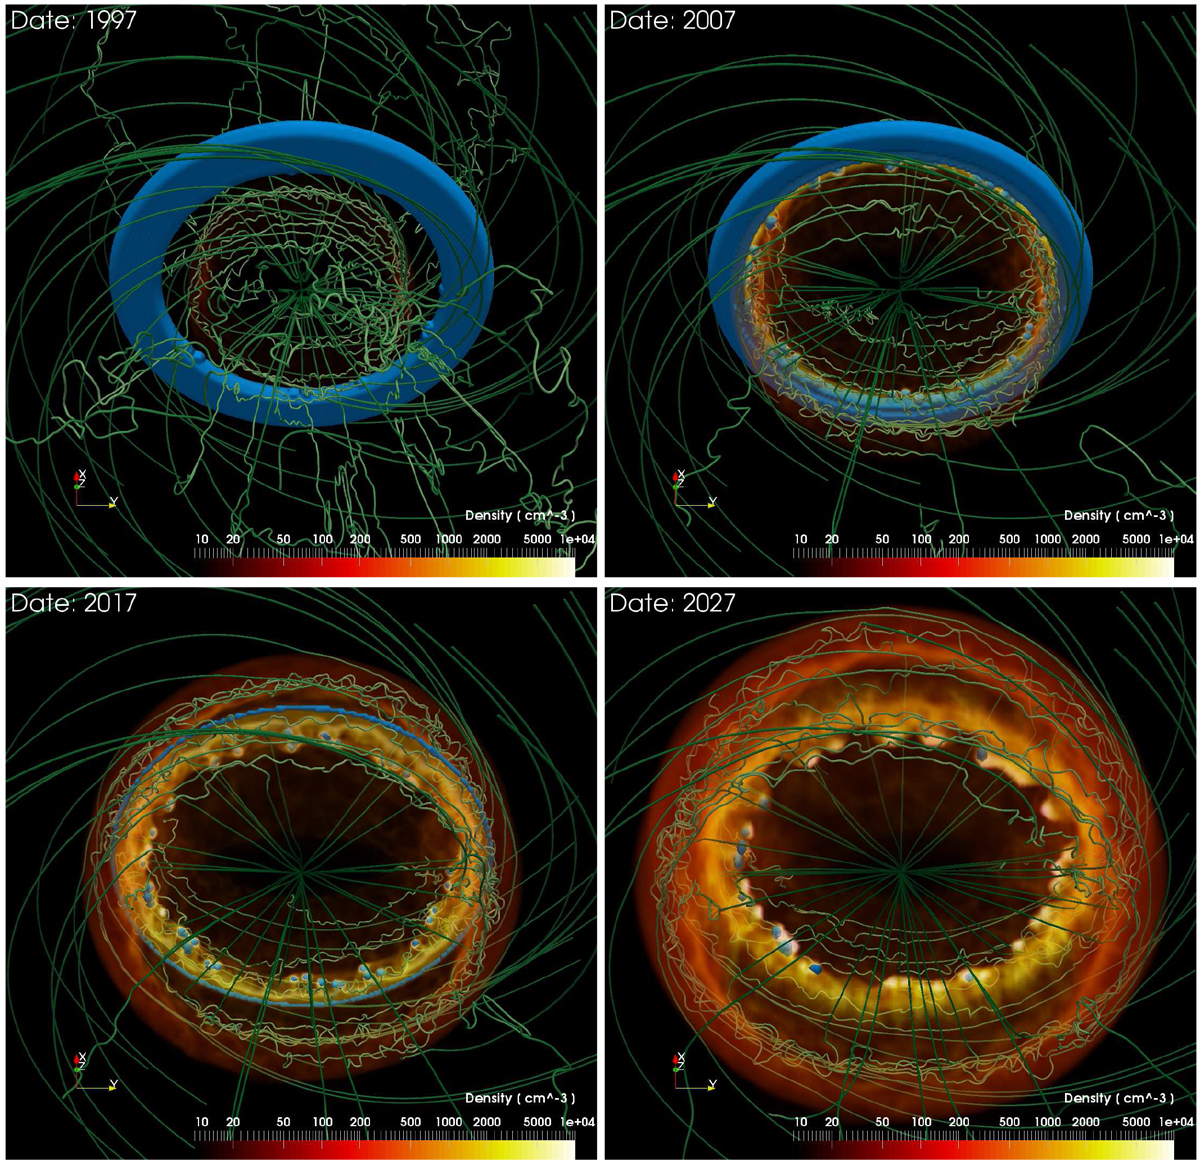
Three-dimensional volume rendering of the number density during the interaction of the blast wave with the magnetized nebula at the labeled times for model MOD-B1. The density of the shocked plasma is in red and that of the unshocked equatorial ring material (with n ≥ 1000 cm−3) is in blue. The green lines are sampled magnetic field lines; the scale of the magnetic field strength is log and is the same as in Fig. 1 (see online Movie 1 for an animation of these data).
Current usage metrics show cumulative count of Article Views (full-text article views including HTML views, PDF and ePub downloads, according to the available data) and Abstracts Views on Vision4Press platform.
Data correspond to usage on the plateform after 2015. The current usage metrics is available 48-96 hours after online publication and is updated daily on week days.
Initial download of the metrics may take a while.