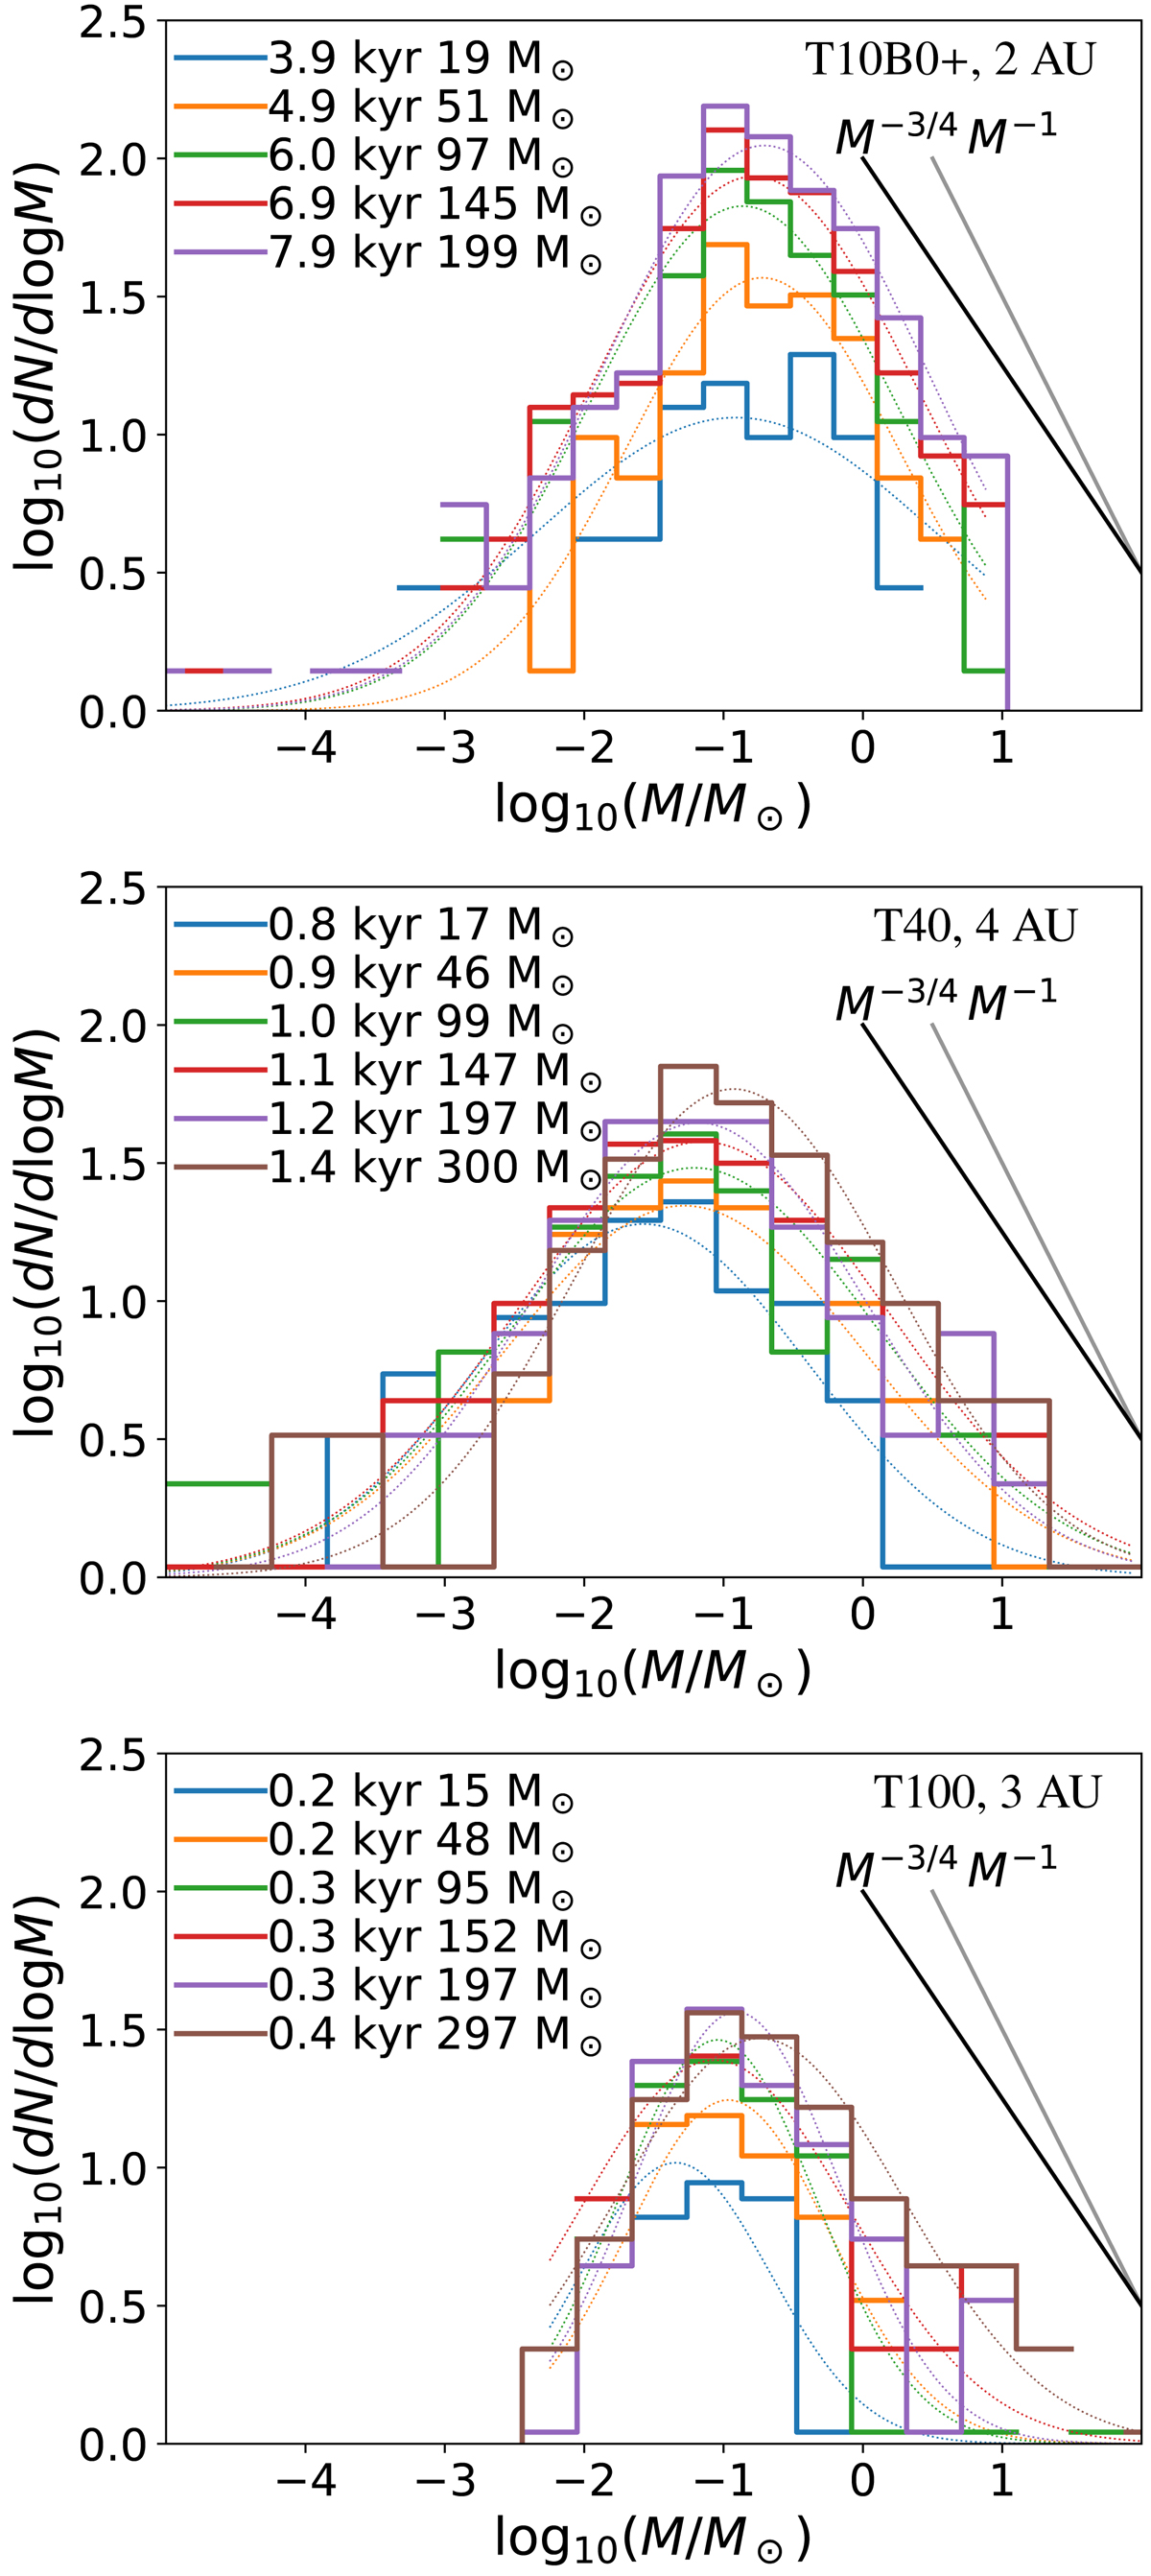
Fig. 2.

Mass spectra with varying cloud bulk temperature. The colors blue, orange, green, red, purple, and brown represent the time at which about 20, 50, 100, 150, 200, and 300 M⊙ have been accreted onto sink particles. Lognormal fits are shown with thin lines for reference. Top panel: canonical run T10M0+ (run C++ in Paper I), where the non-magnetized run has an EOS that sets the low-density gas to T0 = 10 K. Middle panel: (T40) with T0 = 40 K, similar peak position as the canonical run. Bottom panel: (T100) with T0 = 100 K, same characteristic peak mass, while the formation of low-mass sinks is clearly more difficult.
Current usage metrics show cumulative count of Article Views (full-text article views including HTML views, PDF and ePub downloads, according to the available data) and Abstracts Views on Vision4Press platform.
Data correspond to usage on the plateform after 2015. The current usage metrics is available 48-96 hours after online publication and is updated daily on week days.
Initial download of the metrics may take a while.


