Fig. 5
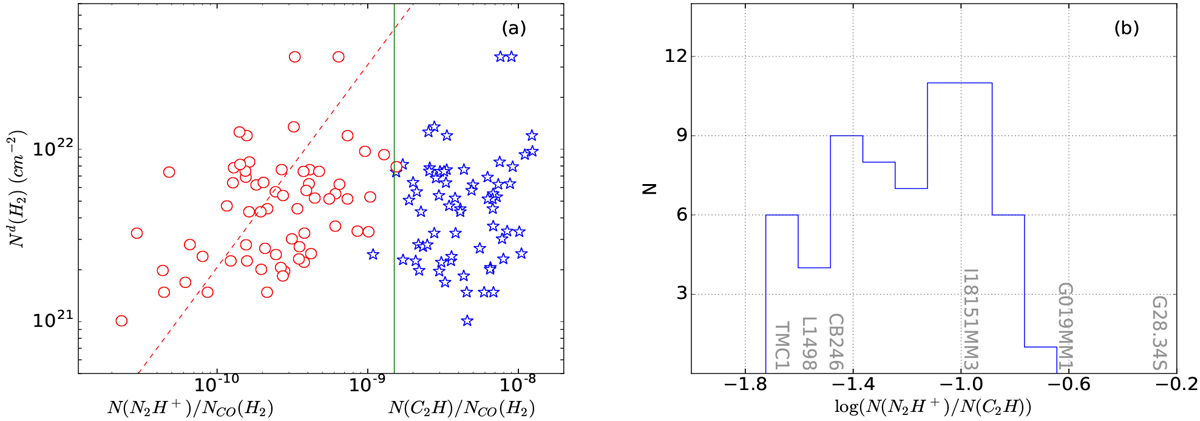
Panela: relation between the abundances of C2H and N2 H+ of CO-selected cores and the H2 column densities of their host PGCCs (Nd(H2)). The abundances of C2H and N2 H+ of our sourceslocate in two different regions separated by the green line. The dashed red line shows the result of linear least-square fitting on data represented by red circles. Panel b: blue line shows number density distribution of log(N(N2H+)/N(C2H)) for our detected PGCC sources. The value of this parameter for typical sources are also shown, including well known starless cores TMC-1 (Hirota et al. 2004; Liszt et al. 2018), L1498 and CB246 (Padovani et al. 2009), massive clumps associated with infrared dark clouds I18151-1208 MM3 (abbreviated as I18151MM3) and G019.27+0.07 MM1 (abbreviated as G019MM1; Sakai et al. 2008, 2010), as well as the infrared dark cloud G028.23-00.19 (Sanhueza et al. 2013).
Current usage metrics show cumulative count of Article Views (full-text article views including HTML views, PDF and ePub downloads, according to the available data) and Abstracts Views on Vision4Press platform.
Data correspond to usage on the plateform after 2015. The current usage metrics is available 48-96 hours after online publication and is updated daily on week days.
Initial download of the metrics may take a while.