Free Access
Fig. 4
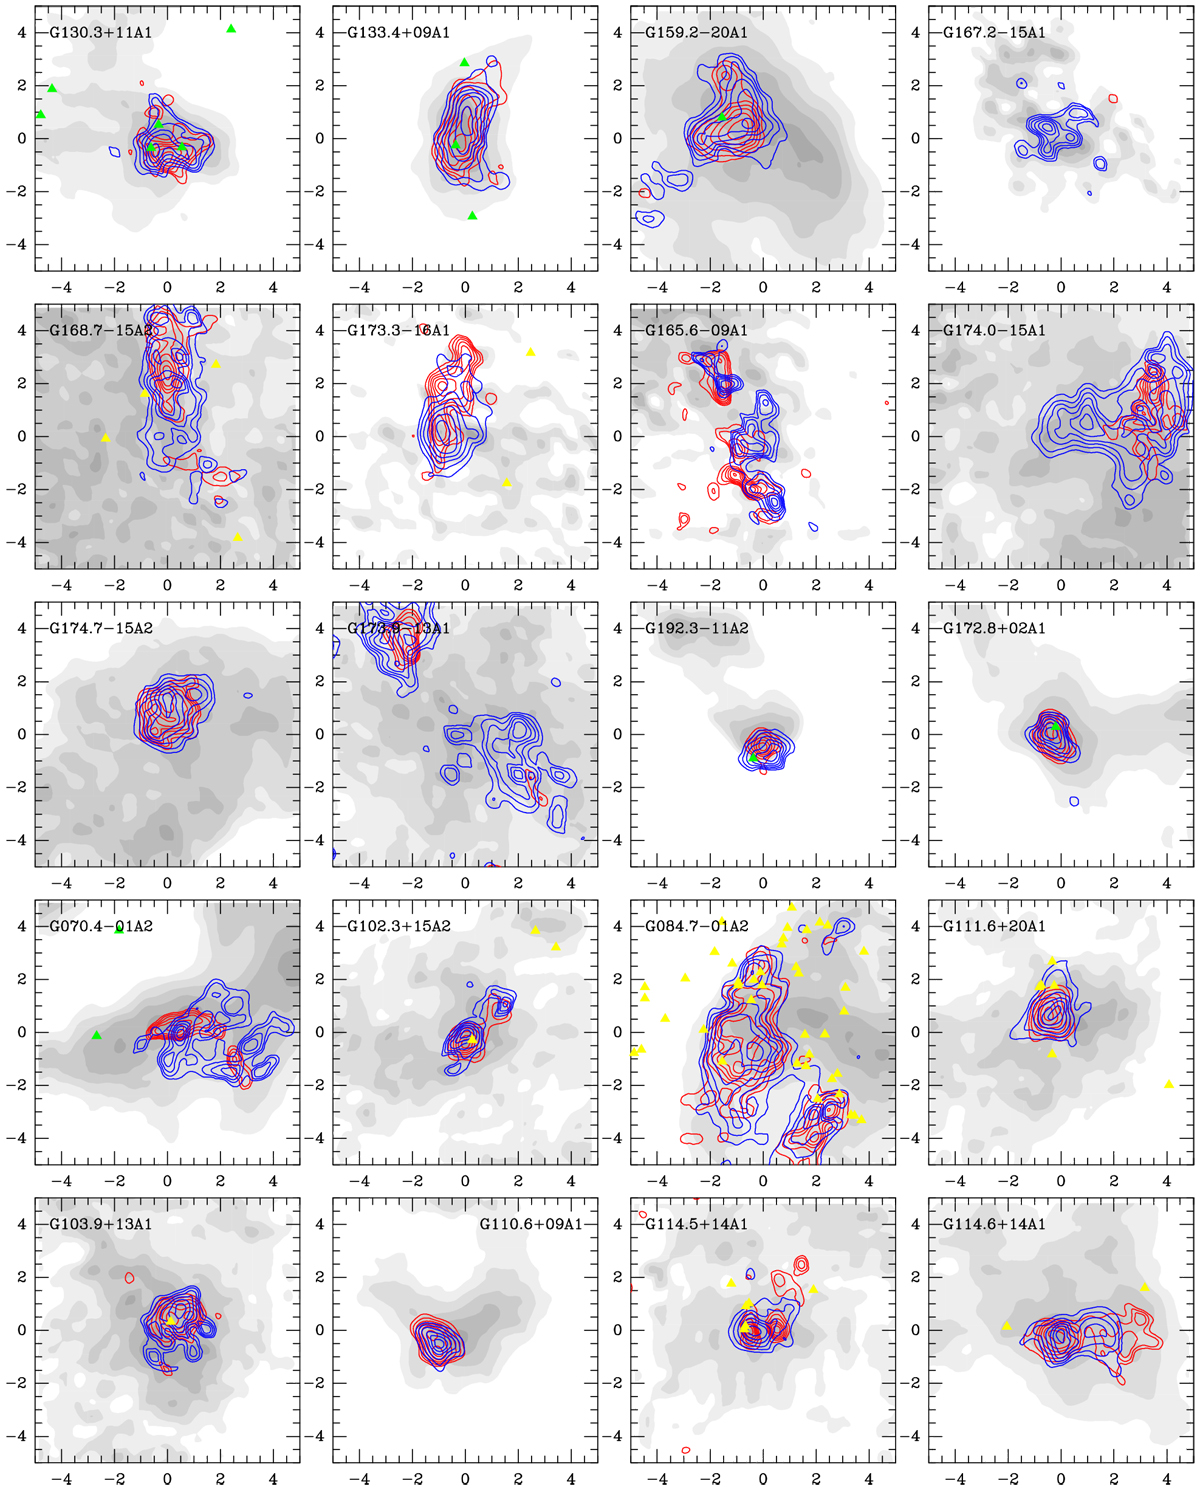
Contours of integrated intensities of C2H N = 1 − 0 (blue) and N2H+ J = 1 − 0 (red) from 45 to 95% stepped by 10% of maximum value. Background shows 13CO emission. Yellow triangles and green stars represent 2MASS sources and IRAS sources quoted from Simbad, respectively.
Current usage metrics show cumulative count of Article Views (full-text article views including HTML views, PDF and ePub downloads, according to the available data) and Abstracts Views on Vision4Press platform.
Data correspond to usage on the plateform after 2015. The current usage metrics is available 48-96 hours after online publication and is updated daily on week days.
Initial download of the metrics may take a while.