Fig. 3
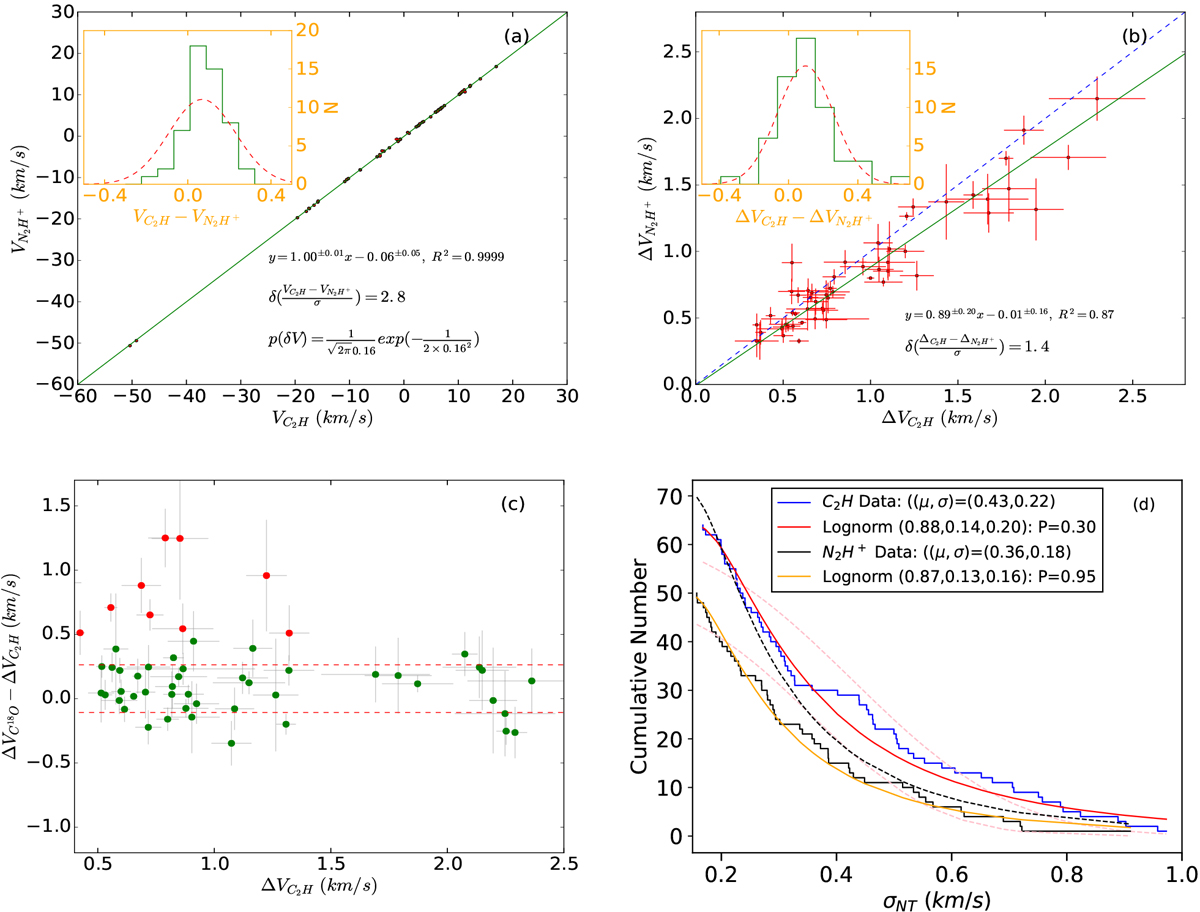
Panela: correlation between the centroid velocity of C2H N = 1 − 0 and that of N2H+ J = 1 − 0. The green solid line represents the result of linear least-squares fitting. Panel b: correlation between the line width of C2 H N = 1 − 0 and that of N2H+ J = 1 − 0. Blue dashed line represents ΔV![]() =
ΔV
=
ΔV![]() .
Panel c: correlation between line width of C2H N = 1 − 0 and the difference between the line width of C2H N = 1 − 0 and that of C18O. The two dashed lines denote the 1 σ
values for the distribution of line width differences. Panel d: fittings of the cumulative distribution functions of nonthermal velocities. Red and yellow solid lines show results of lognormal fittings. The three parameters (Eq. (1)) of the best lognormal fits are (0.88, 0.14, 0.20) and (0.87, 0.13, 0.16), respectively. Dashed pink lines show results of standard-normal fittings.
.
Panel c: correlation between line width of C2H N = 1 − 0 and the difference between the line width of C2H N = 1 − 0 and that of C18O. The two dashed lines denote the 1 σ
values for the distribution of line width differences. Panel d: fittings of the cumulative distribution functions of nonthermal velocities. Red and yellow solid lines show results of lognormal fittings. The three parameters (Eq. (1)) of the best lognormal fits are (0.88, 0.14, 0.20) and (0.87, 0.13, 0.16), respectively. Dashed pink lines show results of standard-normal fittings.
Current usage metrics show cumulative count of Article Views (full-text article views including HTML views, PDF and ePub downloads, according to the available data) and Abstracts Views on Vision4Press platform.
Data correspond to usage on the plateform after 2015. The current usage metrics is available 48-96 hours after online publication and is updated daily on week days.
Initial download of the metrics may take a while.