Fig. 1
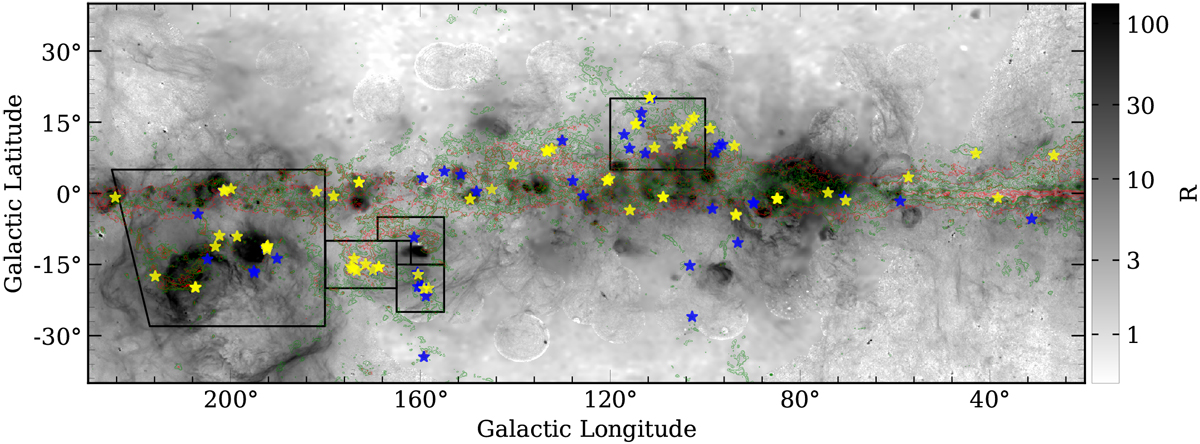
Spatial distribution in the Galactic plane of observed sources. The CO-selected cores with and without detections of C2 H are denoted by the yellow and blue stars, respectively. The background image represents the Hα emission (Finkbeiner 2003) in unit of R (106/4π photons cm−2 s−1 sr−1). The green contours represent CO (1–0) integrated emission detected by Planck HFI (Planck Collaboration XIII 2014). The red contours show the Planck 353 μm continuum emission. The contour levels are (0.05, 0.1, 0.3, 0.5, 0.7, 0.9) × maximum value. Famous star forming regions such as Taurus-Perseus-California (Lombardi et al. 2010), Cepheus, Orion complex (Dame et al. 2001) are sketched with the black line.
Current usage metrics show cumulative count of Article Views (full-text article views including HTML views, PDF and ePub downloads, according to the available data) and Abstracts Views on Vision4Press platform.
Data correspond to usage on the plateform after 2015. The current usage metrics is available 48-96 hours after online publication and is updated daily on week days.
Initial download of the metrics may take a while.