Fig. 4.
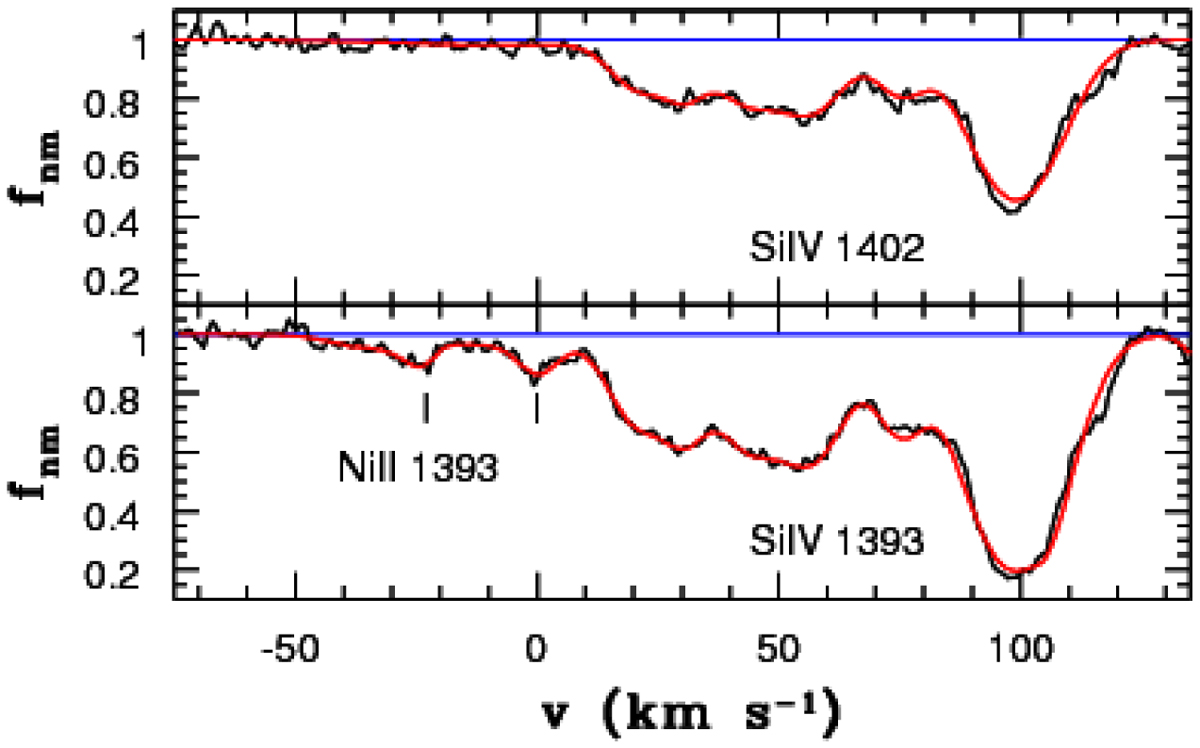
Two Ni IIλ1393 absorption lines towards HE 0027–1836 at zabs = 2.40156 and 2.40185, occurring on the blue end of the extended Si IVλ1393 absorption (lower panel) together with the corresponding Si IVλ1402 profile (upper panel). The fit (red curve) obtained with our Ni IIλ1393 f-value is superimposed onto the observed spectrum (black line). At vhelio = 0 km s−1, the redshift is z = 2.40185.
Current usage metrics show cumulative count of Article Views (full-text article views including HTML views, PDF and ePub downloads, according to the available data) and Abstracts Views on Vision4Press platform.
Data correspond to usage on the plateform after 2015. The current usage metrics is available 48-96 hours after online publication and is updated daily on week days.
Initial download of the metrics may take a while.