Fig. 1.
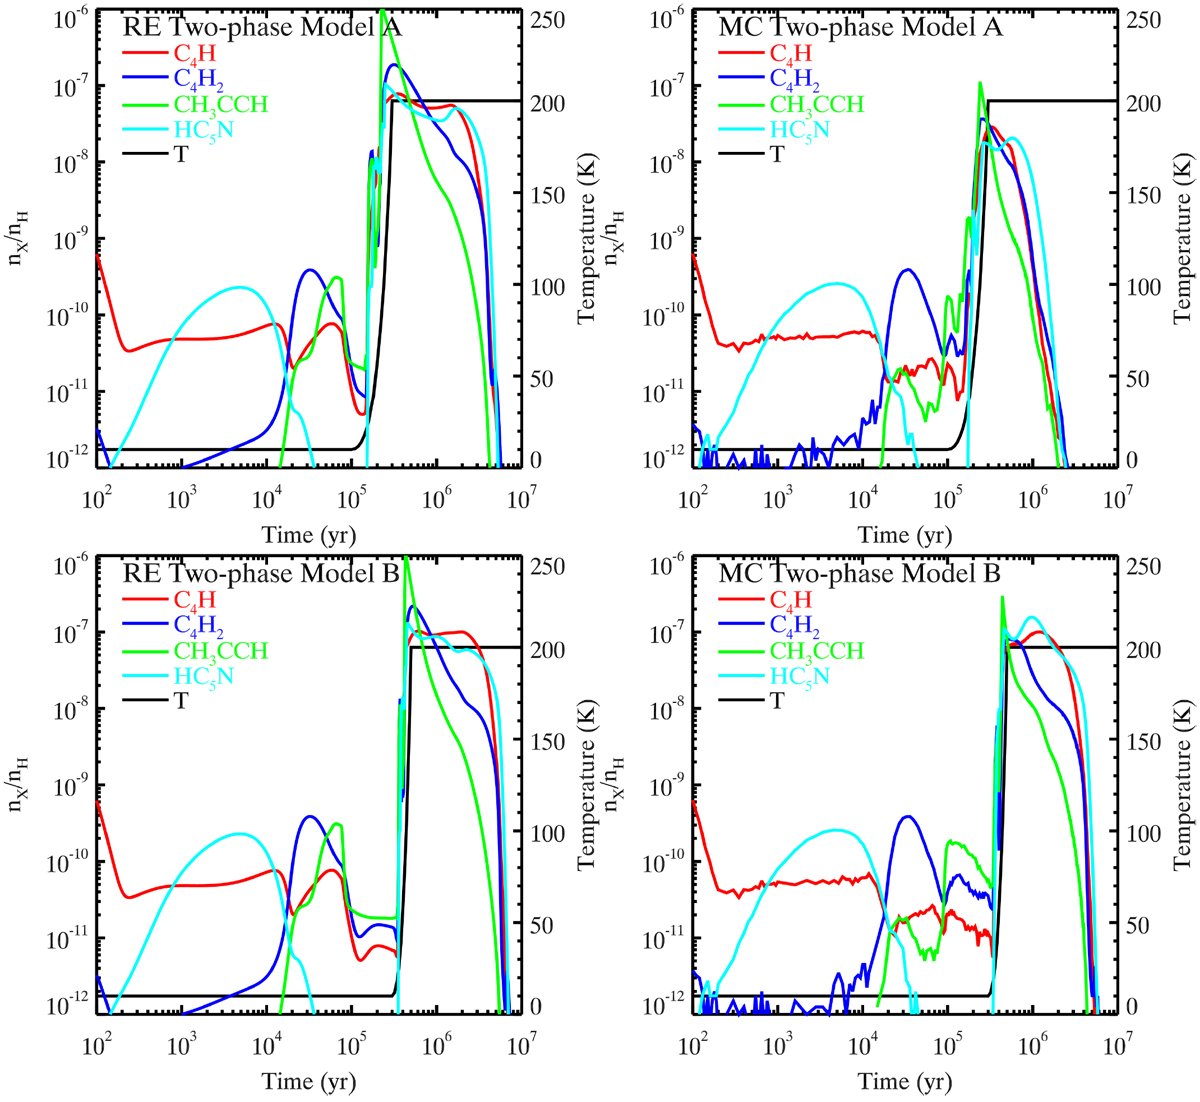
Temporal evolution of the fractional abundances of selected carbon-chain species in the two-phase model simulated with the RE approach and the macroscopic MC method. RE represents the rate equation calculation and MC represents the macroscopic Monte Carlo simulation. The two-phase model adopts different tcold, tcold = 105 yr in the two-phase model A while tcold = 3 × 10⁵ yr in the two-phase model B. The temporal evolution of the temperature T is also plotted in the figure.
Current usage metrics show cumulative count of Article Views (full-text article views including HTML views, PDF and ePub downloads, according to the available data) and Abstracts Views on Vision4Press platform.
Data correspond to usage on the plateform after 2015. The current usage metrics is available 48-96 hours after online publication and is updated daily on week days.
Initial download of the metrics may take a while.