Fig. 2.
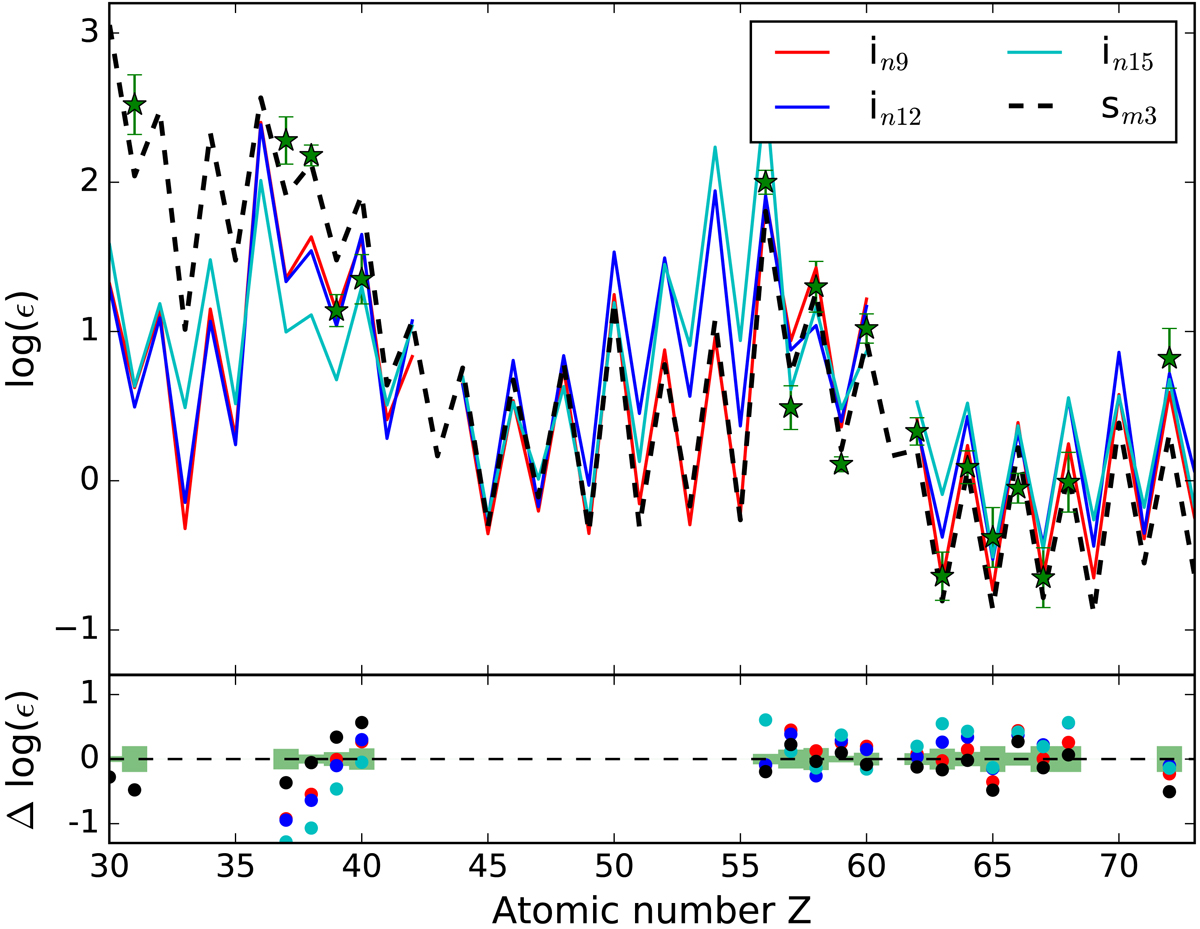
Heavy element pattern in #10464 in comparison with i-process model calculations for various neutron densities reaching from N = 109 cm−3 to N = 1015 cm−3. Here, the s-process curve is for the best-fit 3 M⊙ AGB composition of Lugaro et al. (2012; case “sm3”; Table 3). Top panel: absolute abundances, lower panel: resulting residuals of the individual fits, and errorbars of the abundances as squares. Pb (Z = 82) was excluded from our statistical tests and is thus not shown in this and the following figures.
Current usage metrics show cumulative count of Article Views (full-text article views including HTML views, PDF and ePub downloads, according to the available data) and Abstracts Views on Vision4Press platform.
Data correspond to usage on the plateform after 2015. The current usage metrics is available 48-96 hours after online publication and is updated daily on week days.
Initial download of the metrics may take a while.