Fig. 9.
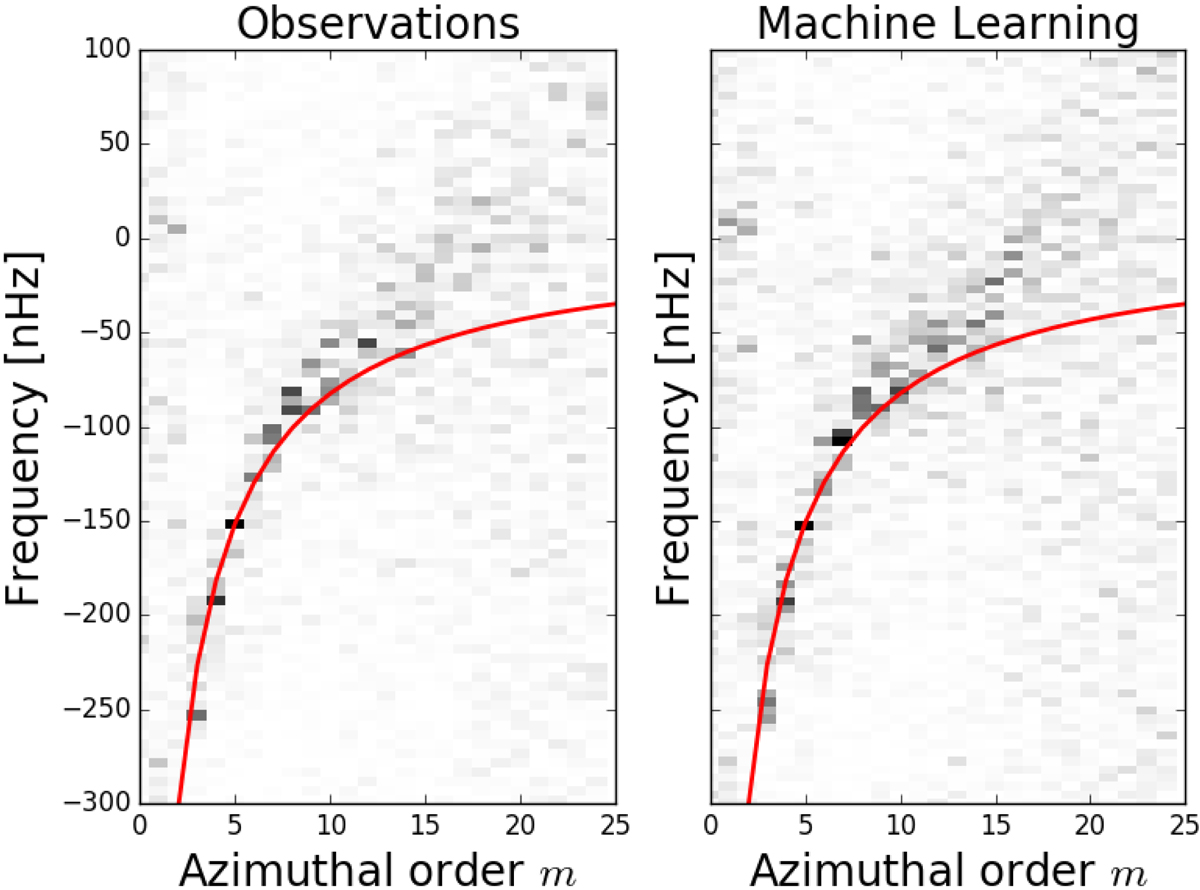
Comparison of the Rossby wave power spectrum computed from ∼6 years (CR 2089-2201) of pipeline data (left panel) and from the machine learning (right panel) for a depth of 0.696 Mm. The machine learning method was trained using 10 Carrington rotations (CR 2079-2088). The red line is the dispersion relation ω = −2Ωref/(m + 1) of sectoral Rossby waves, measured in a frame rotating at the equatorial rotation rate Ωref = 453.1 nHz.
Current usage metrics show cumulative count of Article Views (full-text article views including HTML views, PDF and ePub downloads, according to the available data) and Abstracts Views on Vision4Press platform.
Data correspond to usage on the plateform after 2015. The current usage metrics is available 48-96 hours after online publication and is updated daily on week days.
Initial download of the metrics may take a while.