Fig. 5.
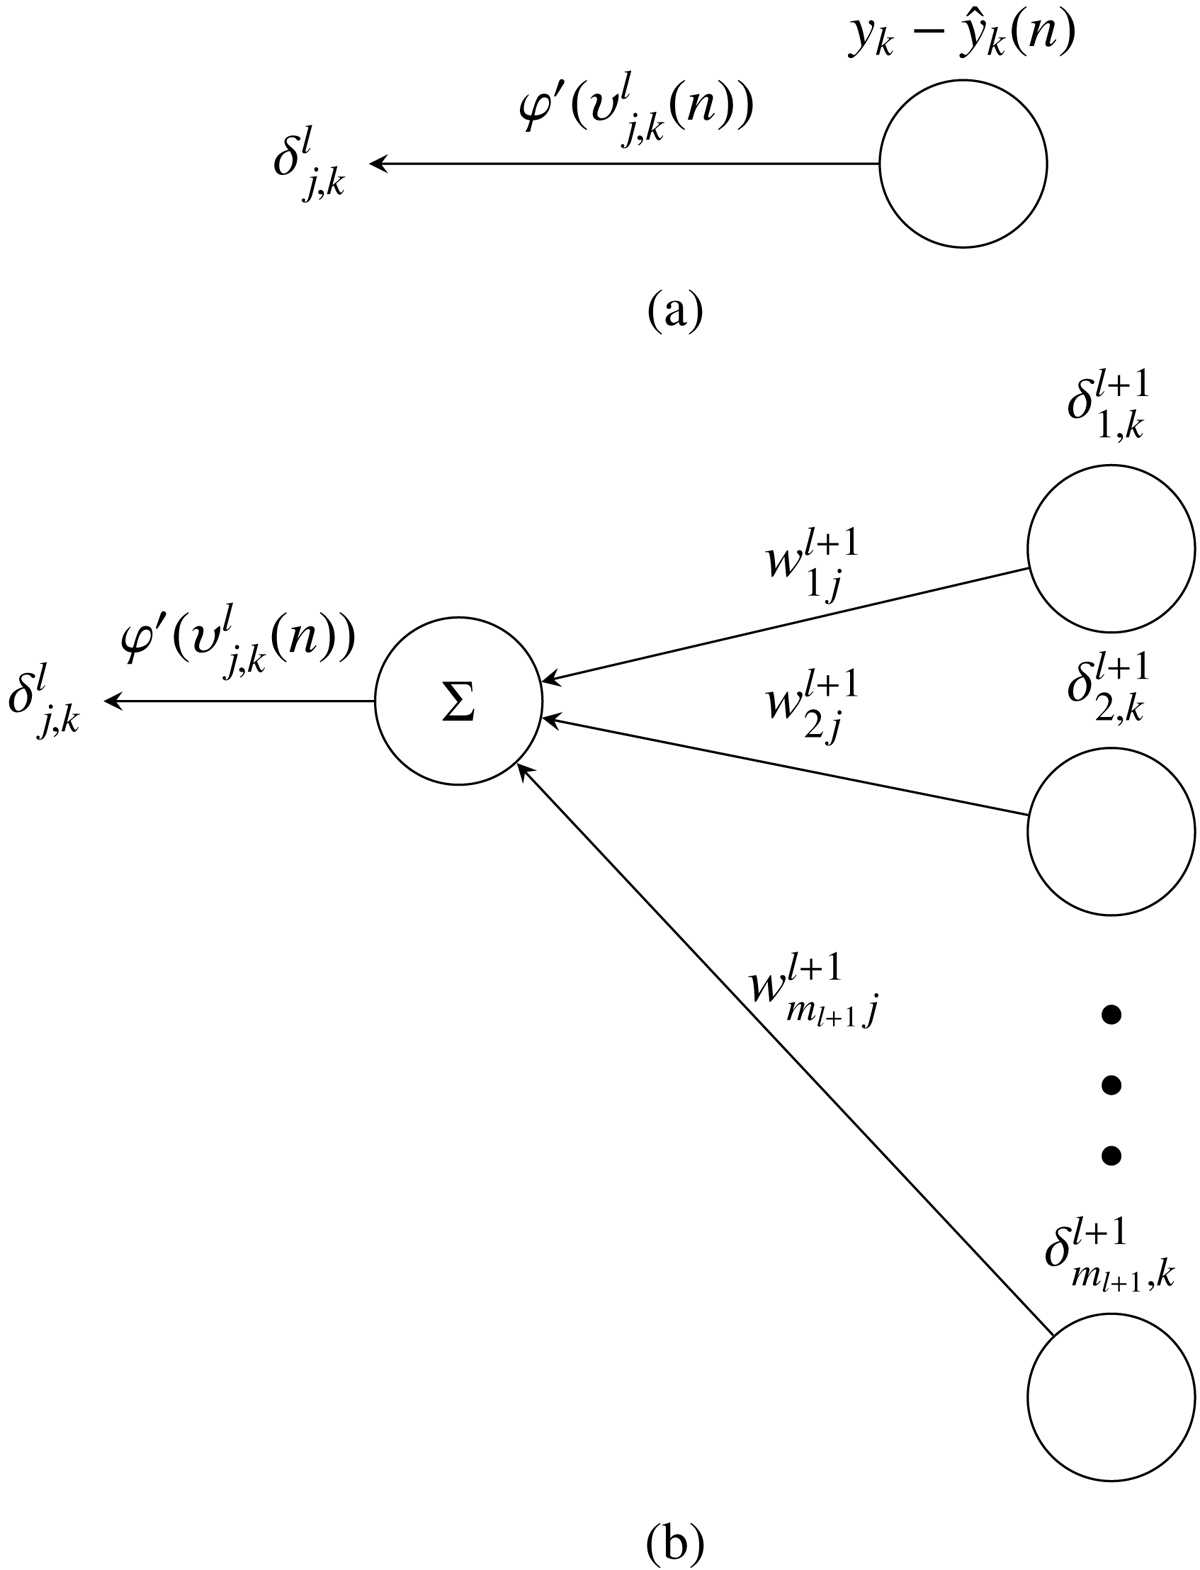
Schematics of the Back-Propagation process, where the error of each neuron δ is computed first from the error in the output layer (panel a), through all the hidden layers (panel b). The weights and bias are updated accordingly. Panel a: schematic of how the error is computed for the output neuron (Eq. (14)). We note that in this study we use the identity function for the activation function of the output, ![]() . Panel b: schematic of how the error of neuron j in hidden layer l is computed from the error of the ml + 1 neurons in layer l + 1 (Eq. (15)).
. Panel b: schematic of how the error of neuron j in hidden layer l is computed from the error of the ml + 1 neurons in layer l + 1 (Eq. (15)).
Current usage metrics show cumulative count of Article Views (full-text article views including HTML views, PDF and ePub downloads, according to the available data) and Abstracts Views on Vision4Press platform.
Data correspond to usage on the plateform after 2015. The current usage metrics is available 48-96 hours after online publication and is updated daily on week days.
Initial download of the metrics may take a while.