Fig. 2.
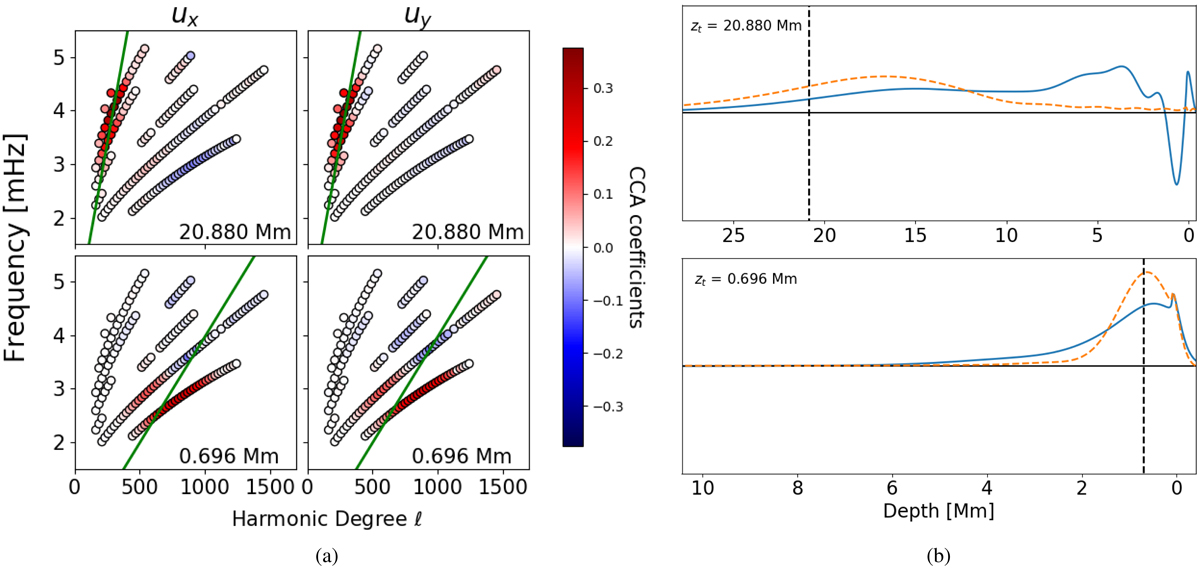
Panel a: coefficients computed using cross-correlation analysis for ux (left panel) and uy (right panel) to reduce the 152 unique modes to a single feature for each depth and flow component. Here we show the coefficients for two depths, 20.88 Mm (top panel) and 0.696 Mm (bottom panel). The CCA computes the ideal weights for the original data, given correlations with the output flows at a single depth. The phase speed corresponding to lower turning points at the target depth is also shown (green line). Modes close to this phase speed are given greater weight by the CCA. Panel b: averaging kernel built using the inversion pipeline (orange dashed) for a single tile, and an equivalent kernel built using the CCA coefficients derived using all tiles (blue line).
Current usage metrics show cumulative count of Article Views (full-text article views including HTML views, PDF and ePub downloads, according to the available data) and Abstracts Views on Vision4Press platform.
Data correspond to usage on the plateform after 2015. The current usage metrics is available 48-96 hours after online publication and is updated daily on week days.
Initial download of the metrics may take a while.