Fig. 7.
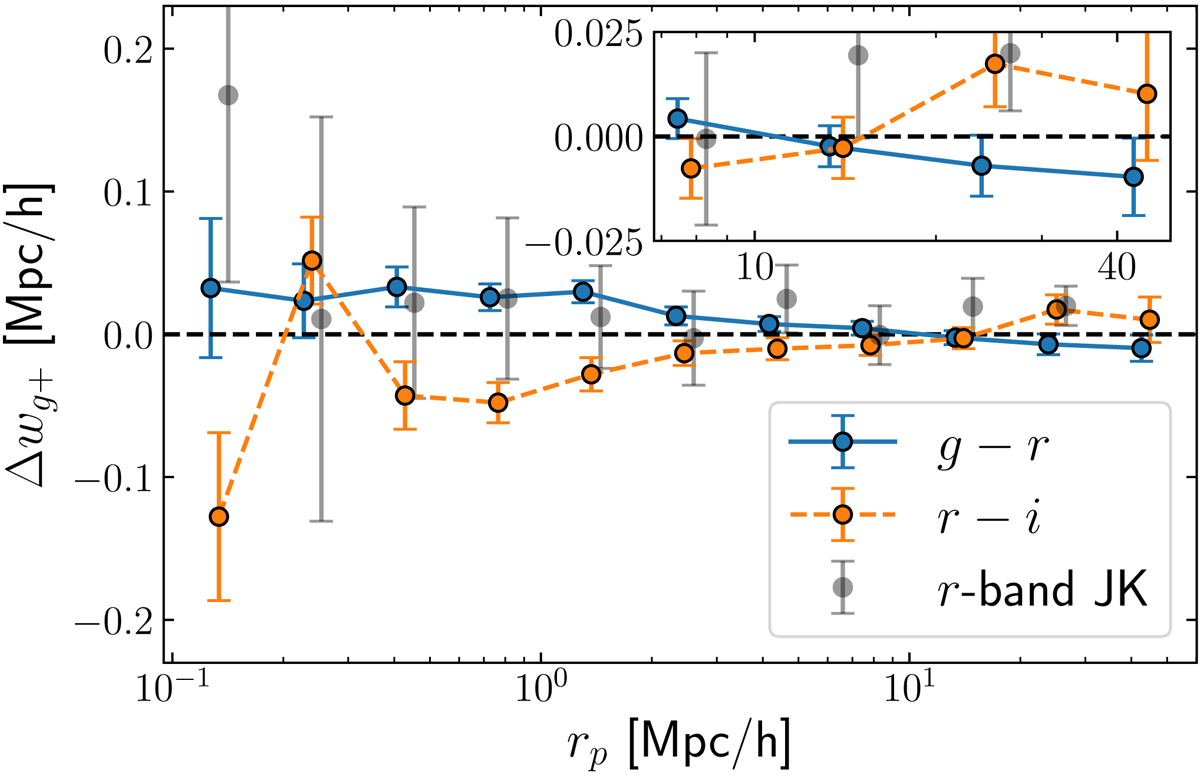
Difference in projected density-shape correlation function between the g − r and r − i filters (blue and orange points respectively). The x-axis shows the transverse separation of galaxy pairs. For reference, the signal measured in r-band is shown with grey points, with errors obtained from 3D jackknife resampling. The in-line figure is a zoom-in on the last four data points, in the highest separations. Points are horizontally displaced for clarity.
Current usage metrics show cumulative count of Article Views (full-text article views including HTML views, PDF and ePub downloads, according to the available data) and Abstracts Views on Vision4Press platform.
Data correspond to usage on the plateform after 2015. The current usage metrics is available 48-96 hours after online publication and is updated daily on week days.
Initial download of the metrics may take a while.