Free Access
Fig. 6.
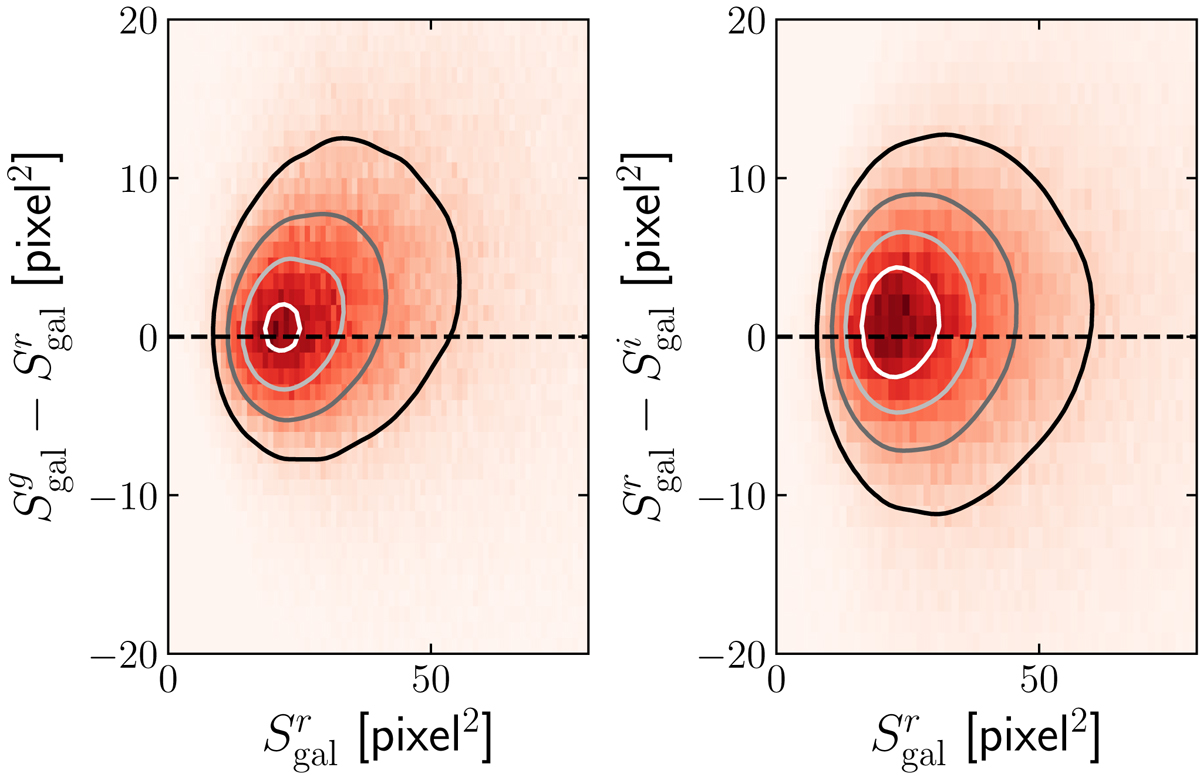
Comparison of galaxy sizes, given from Eq. (12), between g and r-band sizes (left) and r and i-band (right). The density map is shown, with denser regions appearing redder. Equally spaced contours are overlaid for clarity.
Current usage metrics show cumulative count of Article Views (full-text article views including HTML views, PDF and ePub downloads, according to the available data) and Abstracts Views on Vision4Press platform.
Data correspond to usage on the plateform after 2015. The current usage metrics is available 48-96 hours after online publication and is updated daily on week days.
Initial download of the metrics may take a while.