Fig. B.2.
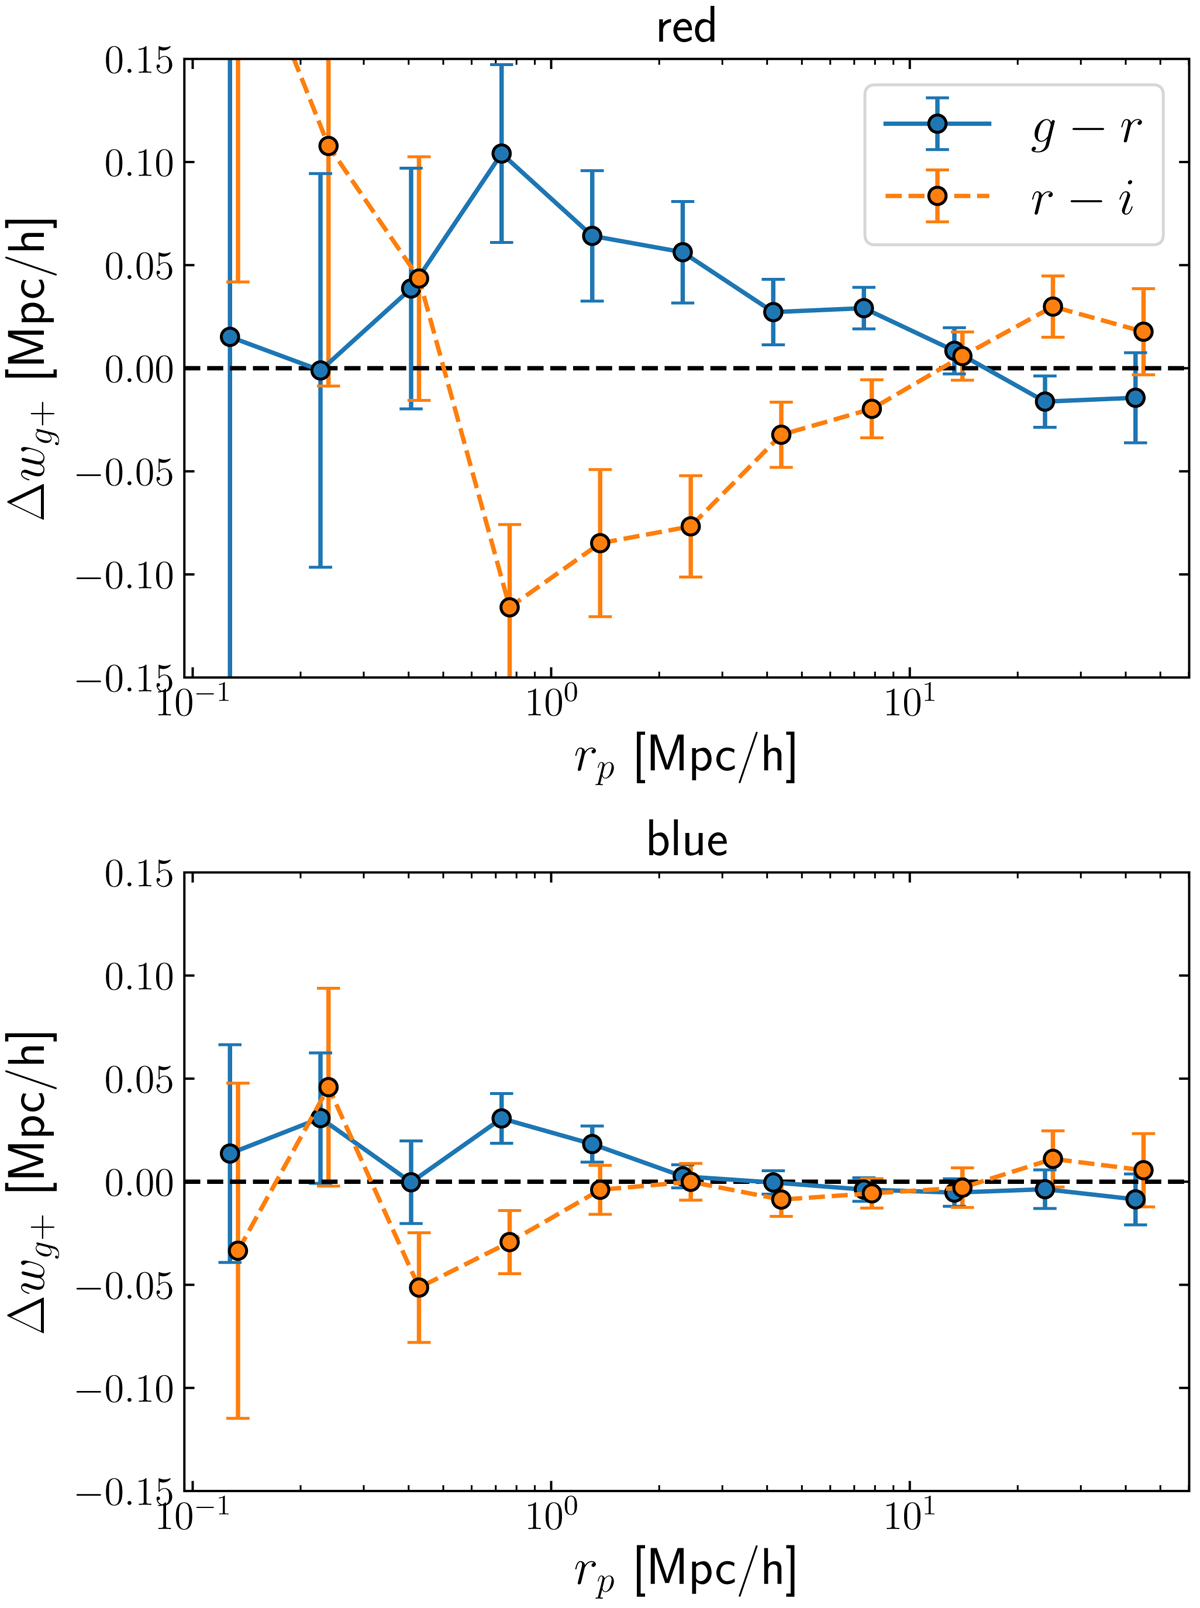
Difference in projected density-shape correlation function between the g − r and r − i filters (blue and orange points, respectively). The correlations were measured using intrinsically red (top panel) and blue (bottom panel) galaxy sub-samples for both the shape and density field. The x-axis shows the transverse separation of galaxy pairs. Points are horizontally displaced for clarity.
Current usage metrics show cumulative count of Article Views (full-text article views including HTML views, PDF and ePub downloads, according to the available data) and Abstracts Views on Vision4Press platform.
Data correspond to usage on the plateform after 2015. The current usage metrics is available 48-96 hours after online publication and is updated daily on week days.
Initial download of the metrics may take a while.