Fig. 4.
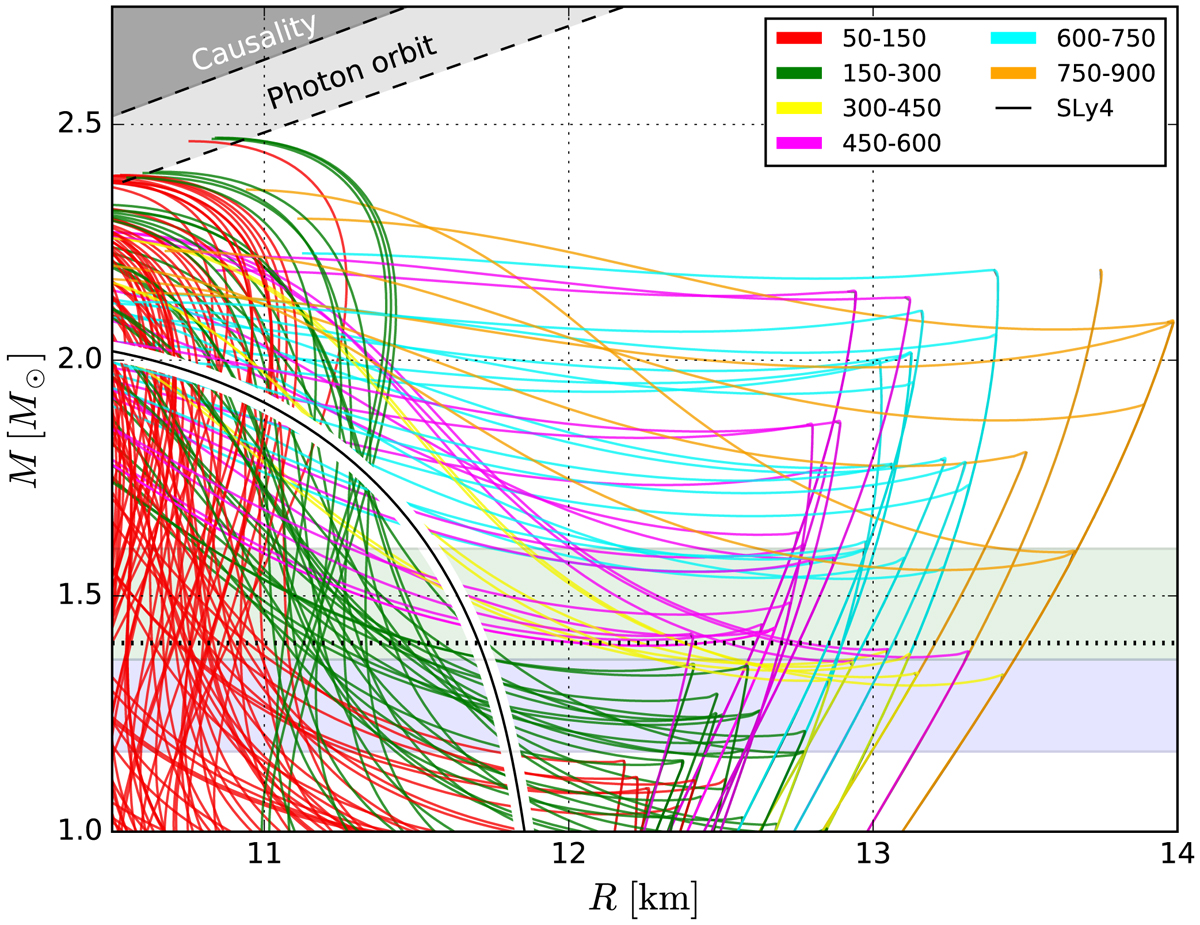
Mass-radius diagram for the poly-quark EOS (α = 1) with the curves colour-coded according to their Λ(M1.4) values. The black-on-white solid line denotes the SLy4 EOS M(R). The regions with different Λ(M1.4) overlap each other, also because one sequence may have several values of Λ(M1.4) due to the nature of the strong phase transition around M = 1.4 M⊙. The non-trivial behaviour of M(R) hinders the separation of the EOS on the M(R) plane with respect to the values of Λ(M1.4) they yield (as proposed in Annala et al. 2018).
Current usage metrics show cumulative count of Article Views (full-text article views including HTML views, PDF and ePub downloads, according to the available data) and Abstracts Views on Vision4Press platform.
Data correspond to usage on the plateform after 2015. The current usage metrics is available 48-96 hours after online publication and is updated daily on week days.
Initial download of the metrics may take a while.