Fig. 2.
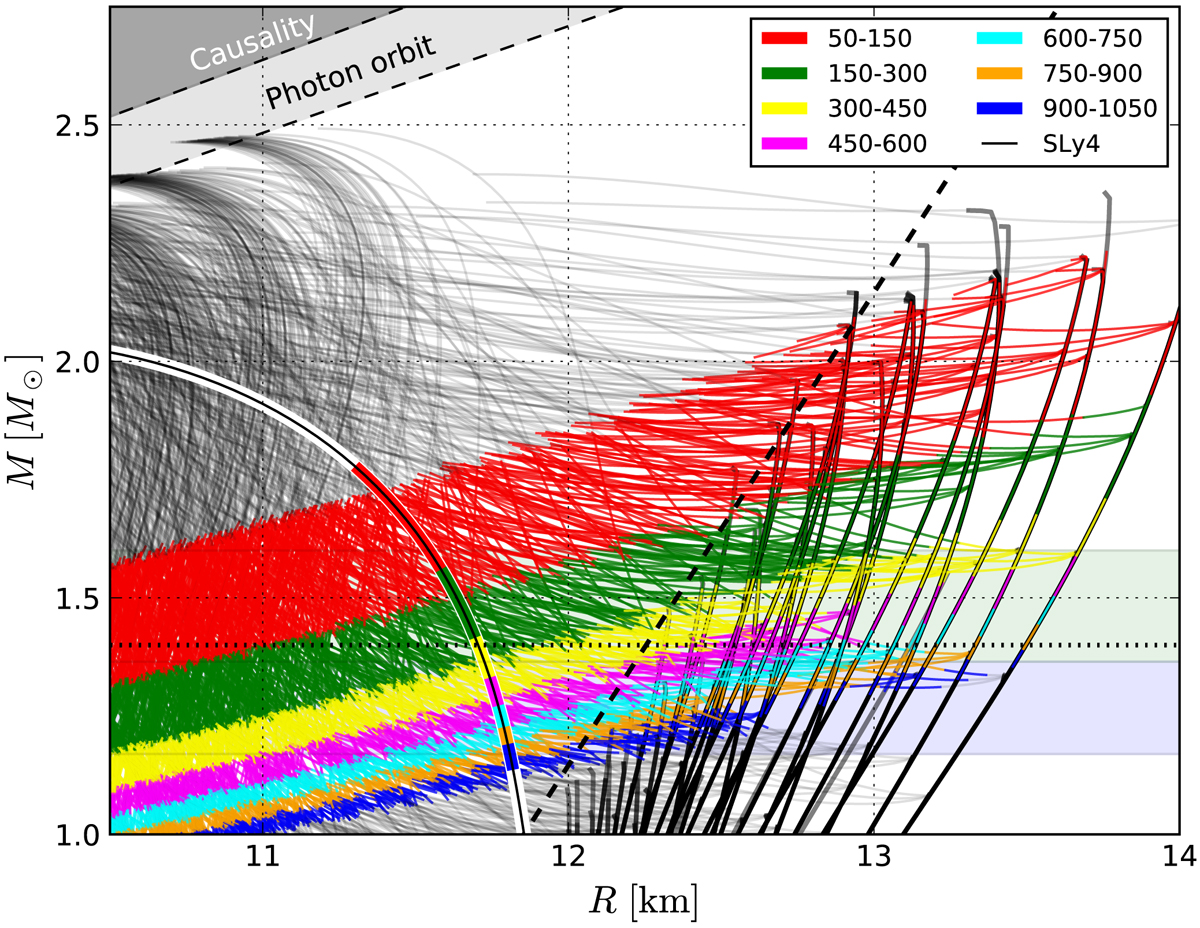
Mass-radius diagram for the poly-quark EOS (α = 1) with the ranges of Λ(M, R) values colour-coded (see inset). The configurations on the M(R) plane may have significantly different Λ values. This is especially visible for the black-on-white line denoting the SLy4 EOS M(R), which is placed on the top of its Λ ranges (see Fig. 3 for a closeup). The dotted horizontal line denotes 1.4 M⊙. The dashed inclined black line denotes an approximate division between the purely polytropic M(R) sequences and sequences containing quark core (see Eq. (12)). The pale green and blue bands correspond to the component mass ranges estimated in the low-spin prior case of GW170817 (Abbott et al. 2017). For reference, in the upper left corner of the plot we indicate the regions excluded by the requirement of the EOS causality (speed of sound in the dense matter less than the speed of light in vacuum, Haensel et al. 1999), and the photon orbit (3GM/Rc2) in the Schwarzschild case.
Current usage metrics show cumulative count of Article Views (full-text article views including HTML views, PDF and ePub downloads, according to the available data) and Abstracts Views on Vision4Press platform.
Data correspond to usage on the plateform after 2015. The current usage metrics is available 48-96 hours after online publication and is updated daily on week days.
Initial download of the metrics may take a while.