Fig. 16.
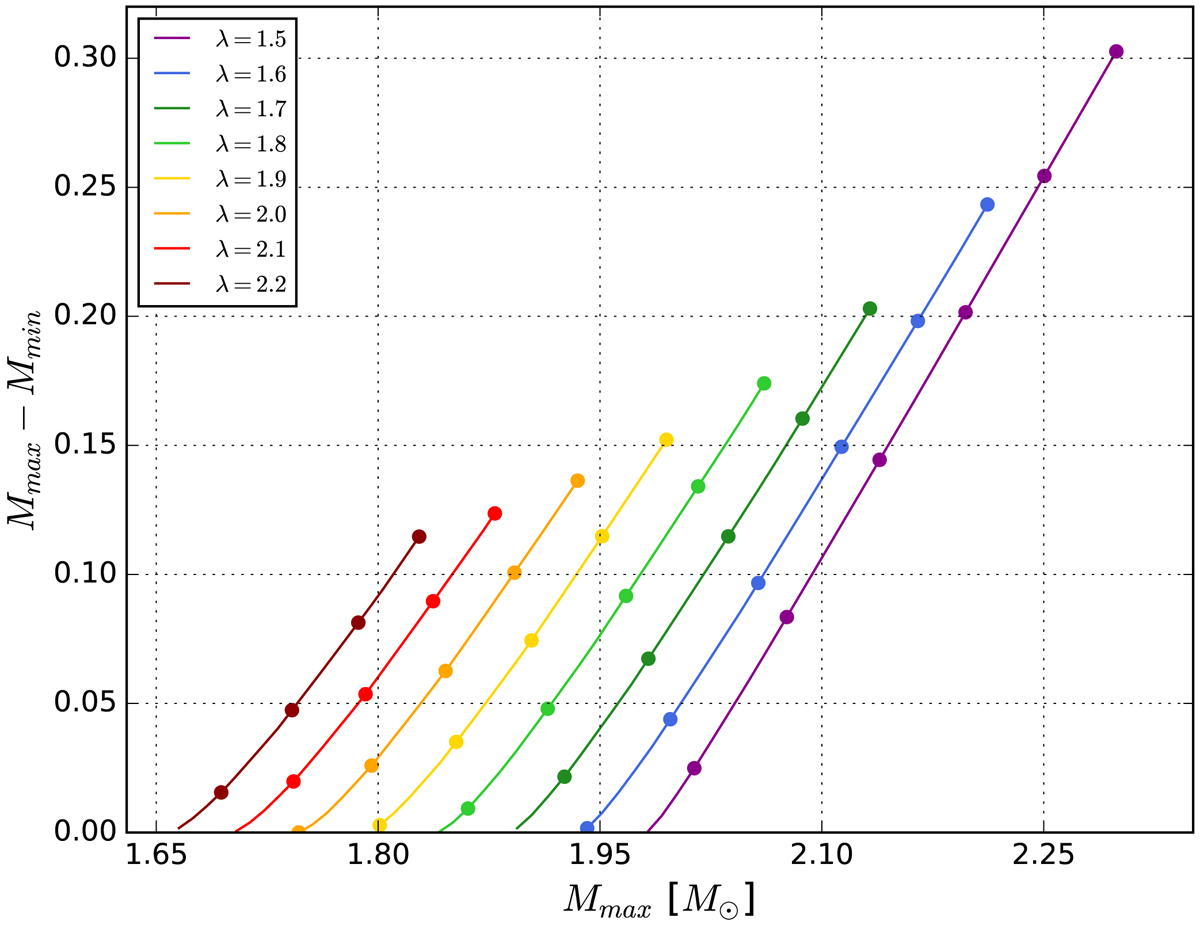
Exemplary B EOS case where the phase transition occurs at Mph = 2 M⊙. The relation between the values of maximum mass Mmax and the difference between Mmax and Mmin. For a given λ this dependence is approximately linear for a broad range of λ parameter and α parameters. Along each curve the α parameter decreases from top to bottom if the figure, with a step of 0.1. The topmost dots correspond to α = 1.0.
Current usage metrics show cumulative count of Article Views (full-text article views including HTML views, PDF and ePub downloads, according to the available data) and Abstracts Views on Vision4Press platform.
Data correspond to usage on the plateform after 2015. The current usage metrics is available 48-96 hours after online publication and is updated daily on week days.
Initial download of the metrics may take a while.