Fig. 15.
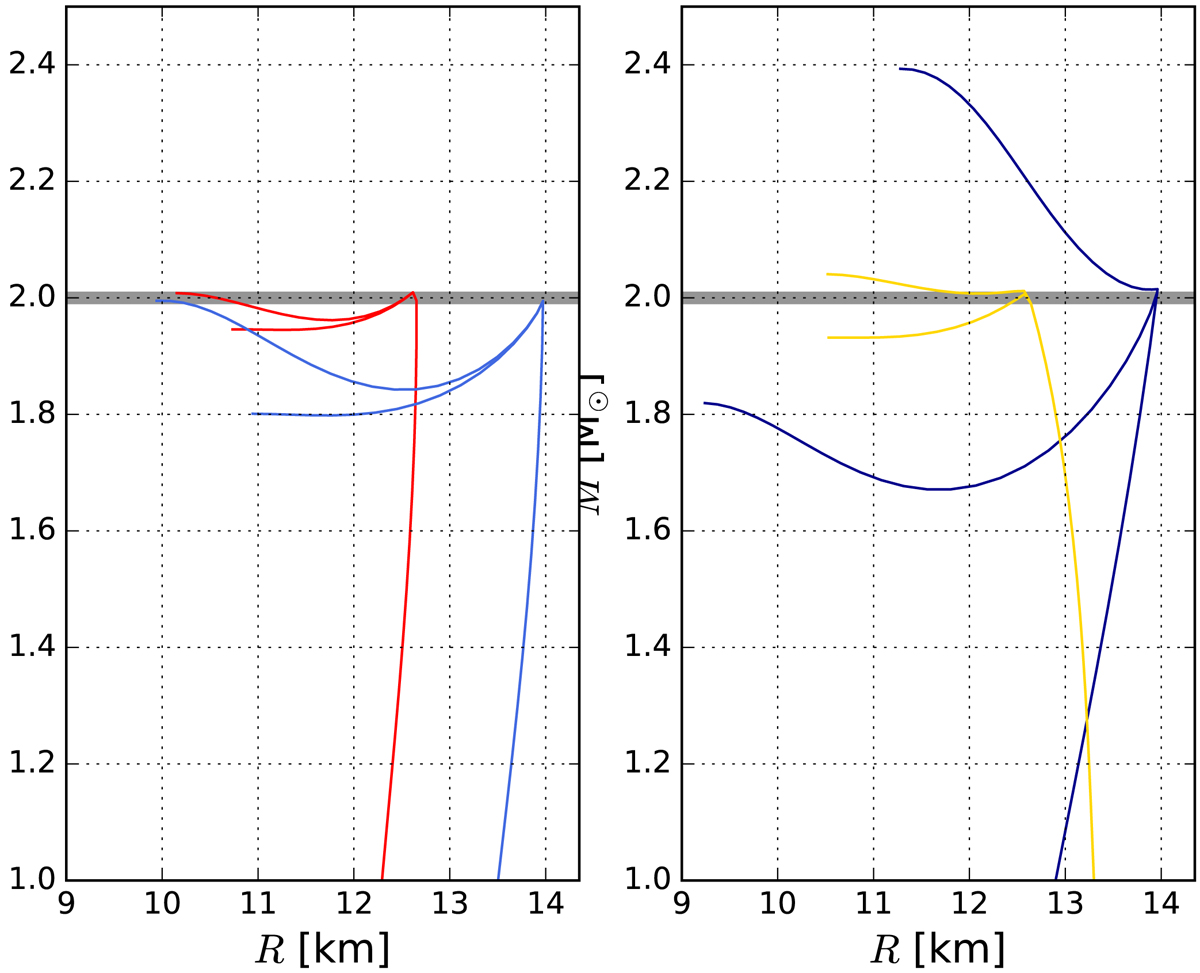
Presence of a twin branch as a function the speed of sound in quark matter ![]() (blue and red curves, left panel) and the density jump λ (dark blue and yellow, right panel) for the exemplary EOS. Only configurations with the critical values of α and λ for which a stable twin branch can be produced are shown. The high-mass twin branch segments have α in the range from 0.78 (bottom red curve) to 1.00 (top red curve) and 0.60 (bottom blue curve) to 1.00 (top blue curve). Values of λ are in the range from 1.58 (top dark blue curve) to 2.5 (bottom dark blue curve) and 1.34 (top yellow curve) to 1.48 (bottom yellow curve). The remaining EOS parameters (γ, n1, λ, n0 for the right panel and γ, n1, n0, α = 1 for the left panel) correspond to the EOS in Table 2.
(blue and red curves, left panel) and the density jump λ (dark blue and yellow, right panel) for the exemplary EOS. Only configurations with the critical values of α and λ for which a stable twin branch can be produced are shown. The high-mass twin branch segments have α in the range from 0.78 (bottom red curve) to 1.00 (top red curve) and 0.60 (bottom blue curve) to 1.00 (top blue curve). Values of λ are in the range from 1.58 (top dark blue curve) to 2.5 (bottom dark blue curve) and 1.34 (top yellow curve) to 1.48 (bottom yellow curve). The remaining EOS parameters (γ, n1, λ, n0 for the right panel and γ, n1, n0, α = 1 for the left panel) correspond to the EOS in Table 2.
Current usage metrics show cumulative count of Article Views (full-text article views including HTML views, PDF and ePub downloads, according to the available data) and Abstracts Views on Vision4Press platform.
Data correspond to usage on the plateform after 2015. The current usage metrics is available 48-96 hours after online publication and is updated daily on week days.
Initial download of the metrics may take a while.