Fig. 12.
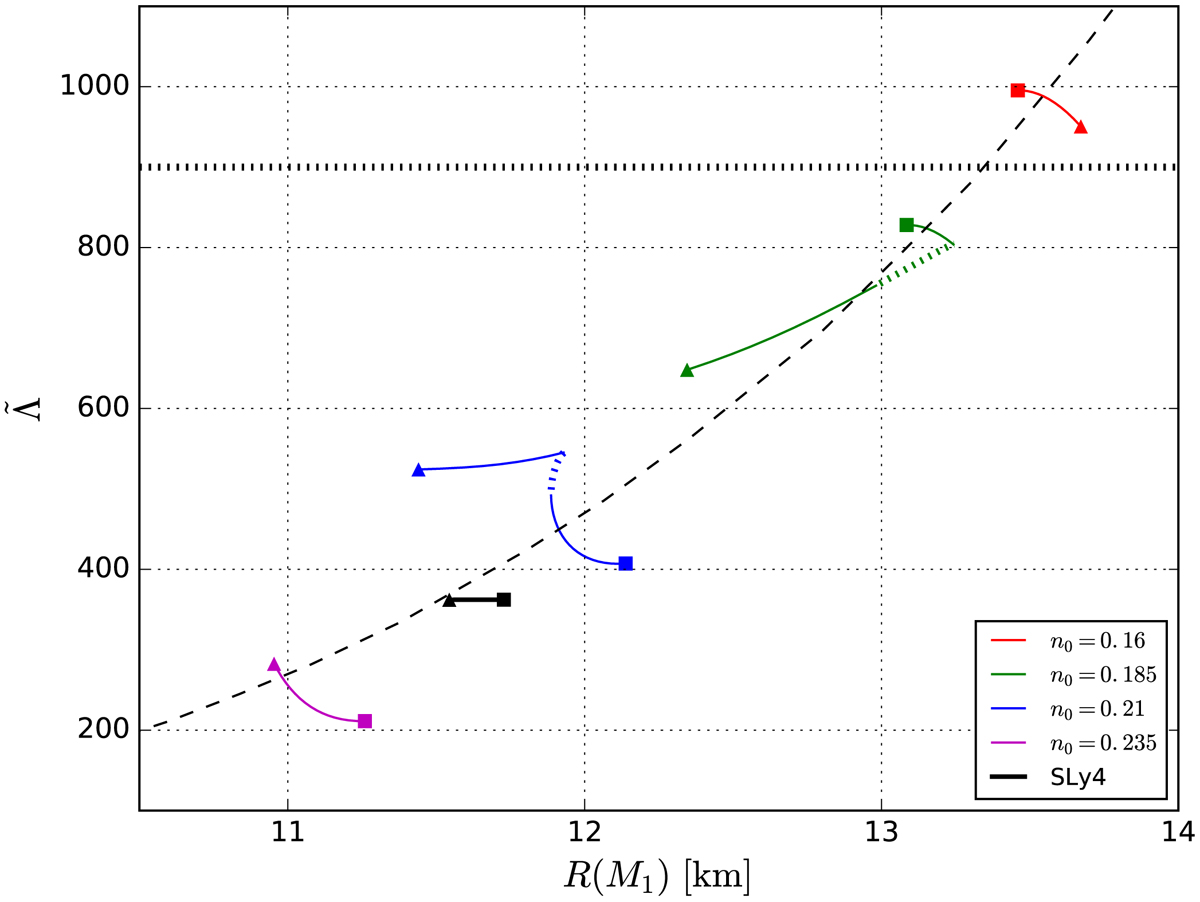
![]() as a function of the radius of the more massive component, R(M1) for the low-spin estimation of parameters of the GW170817 event. Squares denote the lowest estimated mass of the primary component, M1 = 1.36 M⊙, while triangles denote the highest mass, M1 = 1.6 M⊙. The dashed line corresponds to the fit by Raithel et al. (2018). The thick dotted line indicates the 90% confidence limit of 900 for
as a function of the radius of the more massive component, R(M1) for the low-spin estimation of parameters of the GW170817 event. Squares denote the lowest estimated mass of the primary component, M1 = 1.36 M⊙, while triangles denote the highest mass, M1 = 1.6 M⊙. The dashed line corresponds to the fit by Raithel et al. (2018). The thick dotted line indicates the 90% confidence limit of 900 for ![]() (corrected value from Abbott et al. 2019, Table IV). Information about
(corrected value from Abbott et al. 2019, Table IV). Information about ![]() varying with the mass ratio q = M2/M1 for fixed chirp mass is encoded in the plot:
varying with the mass ratio q = M2/M1 for fixed chirp mass is encoded in the plot: ![]() curves for selected EOS follow the fixed chirp mass of GW170817. The square denotes the M1 = 1.36 M⊙ (i.e. M1 = M2, q = 1), while the triangle denotes M1 = 1.60 M⊙ (M2 = 1.17 M⊙, q = 0.725).
curves for selected EOS follow the fixed chirp mass of GW170817. The square denotes the M1 = 1.36 M⊙ (i.e. M1 = M2, q = 1), while the triangle denotes M1 = 1.60 M⊙ (M2 = 1.17 M⊙, q = 0.725).
Current usage metrics show cumulative count of Article Views (full-text article views including HTML views, PDF and ePub downloads, according to the available data) and Abstracts Views on Vision4Press platform.
Data correspond to usage on the plateform after 2015. The current usage metrics is available 48-96 hours after online publication and is updated daily on week days.
Initial download of the metrics may take a while.